Market Position and Market Share
Yara International ASA is one of the world’s foremost crop nutrition and chemical companies, holding a commanding position across several fertilizer and industrial chemical markets:
- Global Traded Ammonia:Yara operates the largest merchant ammonia trading and shipping network worldwide, controlling roughly 20% to 22% of the global seaborne merchant ammonia trade.
- Nitrogen and Mineral Fertilizer Overall:Yara ranks as the #2 fertilizer company globally by total revenue (behind Canada’s Nutrien and ahead of The Mosaic Company), accounting for an estimated 8%–10% global market share in total mineral fertilizers, with dominant leadership in Europe (where it controls >20% of nitrate-based products).
- Nitrates and Specialty Fertilizers: It is the undisputed #1 global producer of calcium nitrate and complex NPKs, positioning it as a premium-price provider rather than a pure commodity player.
- Green & Low-Carbon Fertilizer: Yara leads the nascent low-carbon/green fertilizer segment with an estimated market share exceeding 14%, underpinned by aggressive investments in renewable-ammonia electrolyzers and Carbon Capture and Storage (CCS) infrastructure.
Upstream and Downstream Supply Chain & Key Suppliers
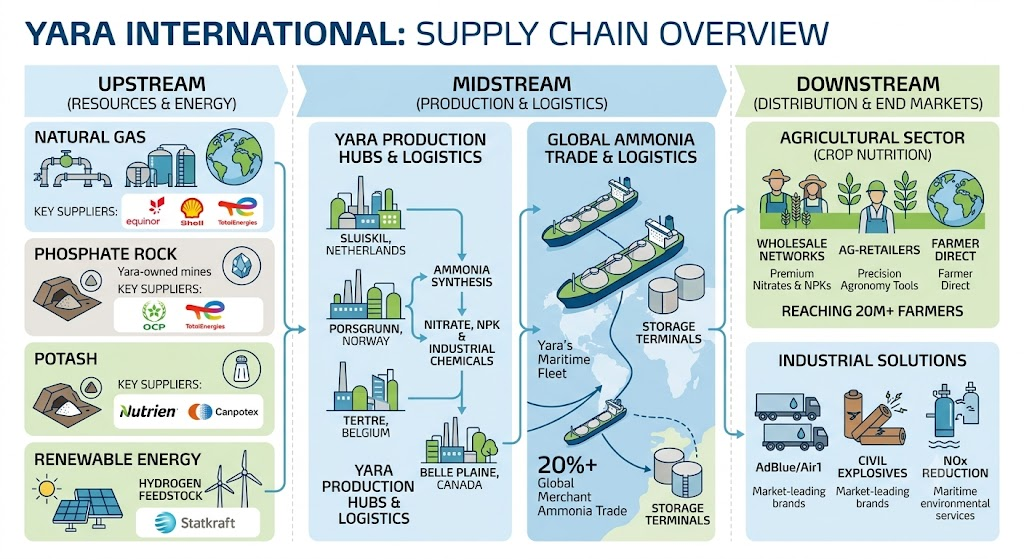
Yara manages a vertically integrated supply chain spanning chemical synthesis, mining, maritime shipping, and agronomic distribution:
1. Upstream (Raw Materials & Energy Feedstock):
- Natural Gas: The primary feedstock for Haber-Bosch ammonia synthesis. Natural gas constitutes the single largest variable cost for Yara’s production. Because a major portion of Yara’s European production relies on Title Transfer Facility (TTF) pricing, energy costs fluctuate significantly compared to North American Henry Hub prices. Key suppliers include major European pipeline and LNG operators (e.g., Equinor, Shell, and TotalEnergies). To mitigate European gas spreads, Yara recently acquired the Gulf Coast Ammonia facility in Texas (securing low-cost US gas).
- Phosphate Rock & Potash (MOP/SOP):Unlike nitrogen, which is synthesized from atmospheric air and hydrogen, Yara sources phosphate and potash via mining. While it owns phosphate rock operations in Siilinjärvi (Finland) and Salitre (Brazil), it procures significant merchant phosphate and potash volumes from third-party mining giants such as OCP Group (Morocco) and Nutrien/Canpotex.
- Green Hydrogen / Renewable Power:Upstream energy suppliers for decarbonized plants include Statkraft (Norway) and Acme Cleantech (for renewable ammonia off-take).
2. Midstream (Manufacturing & Logistics):
- Operates major integrated hubs including Sluiskil (Netherlands), Porsgrunn (Norway), Tertre (Belgium), and Belle Plaine (Canada).
- Maritime Fleet: Yara runs an extensive specialized ammonia tanker fleet (both chartered and owned), terminal networks, and refrigerated storage facilities across Europe, the Americas, and Asia, insulating it against localized logistics disruptions.
3. Downstream (Distribution & End Markets):
- Agriculture (Crop Nutrition): Reaches over 20 million farmers globally via wholesale ag-retail networks, agricultural co-ops, and direct distribution subsidiaries (particularly entrenched in Northern Europe, Brazil, and North America).
- Industrial Solutions: Downstream B2B supply of industrial nitrates for civil explosives (mining/construction), AdBlue/Air1 (diesel exhaust fluid for NOx reduction), and maritime scrubbers.
Competitor Analysis: Technical and Financial Comparison
Yara competes primarily with Nutrien Ltd.and CF Industries Holdings, Inc., as well as regional players like EuroChem, The Mosaic Company, and OCP Group.
1. Financial Dynamics & Profitability:
- Feedstock Cost Structures: CF Industries holds a substantial structural cost advantage over Yara. CF’s operations are heavily concentrated on the US Gulf Coast, locking in ultra-low Henry Hub natural gas costs ($2–$3/MMBtu). In contrast, Yara’s heavy European manufacturing base exposes it to higher TTF gas spreads ($10–$14/MMBtu historical averages), pressuring its baseline upstream nitrogen margins during energy price spikes.
- Revenue and Top-Line Resilience: Yara operates with larger global top-line volume (FY2025 revenue of ~$15.7 billion) compared to CF Industries (~$6–$7 billion), driven by Yara’s expansive trading and retail footprint. However, CF Industries consistently generates superior EBITDA margins (often 40%–50% vs. Yara’s 15%–20%) due to pure-play upstream focus and US gas cost advantages.
- Capital Discipline & Solvency: Nutrien maintains the largest balance sheet in the sector but carries higher absolute debt from its expansive retail ag-store acquisitions. Yara maintains a disciplined balance sheet (Net Debt/Equity around 0.37x in FY2025) and resilient ROIC targeting (>10% across cycles).
2. Technical and Portfolio Differentiation:
- Product Mix (Nitrates vs. Urea): CF Industries and EuroChem emphasize bulk commodity urea and UAN. Yara deliberately targets premium nitrate products (CAN – Calcium Ammonium Nitrate) and complex NPK formulas. Nitrates have lower volatilization losses in temperate soils and command a pricing premium over urea, giving Yara pricing power at the farm gate.
- Decarbonization & CCS Leadership: Yara has established a multi-year technical lead in European industrial decarbonization. Its Sluiskil carbon-capture facility captures and liquefies up to 800,000 tons of CO2 annually for seabed storage via Northern Lights in Norway. Combined with proprietary N2O catalyst abatement technologies applied across its nitric acid plants, Yara is better positioned to navigate the European Union’s Carbon Border Adjustment Mechanism (CBAM) and Emission Trading System (ETS) costs than competitors.
- Digital Farming & Agronomy: Yara has developed the proprietary Atfarm, N-Sensor, and Adapt-N digital agronomy suites, integrating direct soil monitoring with variable-rate fertilizer distribution. While Nutrien possesses a dominant North American proprietary retail software platform (AgSolutions), Yara’s tools are optimized for precision crop-yield efficiency and scope-3 carbon reduction.
Information Sources
- https://www.yara.com/siteassets/investors/057-reports-and-presentations/annual-reports/2025/yara-annual-report-2025.pdf
- https://en.deallab.info/fertilizer/
- https://www.grandviewresearch.com/industry-analysis/ammonia-market
- https://www.gminsights.com/industry-analysis/green-fertilizer-market
- https://simplywall.st/stocks/no/materials/ob-yar/yara-international-shares/news/how-investors-may-respond-to-yara-international-obyar-carbon
- https://www.agribusinessreview.com/yara-international
- https://www.phosphorusplatform.eu/espp-members/1668-Yara
Back to Yara International