
Q2 2026 Financial Results Summary
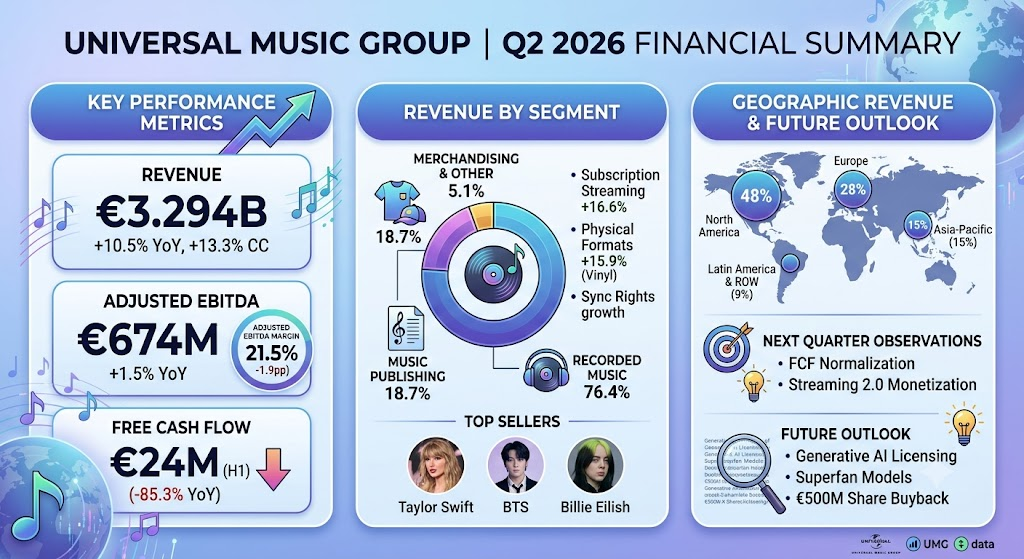
For the second quarter ended June 30, 2026, Universal Music Group N.V.(UMG) reported total revenue of €3,294 million, representing a 10.5% year-over-year increase on a reported basis and 13.3% in constant currency.Organic revenue growth—excluding the impact of the Downtown Music Holdings acquisition consolidated on February 20, 2026—stood at 6.4% in constant currency.
Despite top-line expansion, profitability faced pressure. Adjusted EBITDA rose slightly by 1.5% year-over-year to €674 million, while the Adjusted EBITDA margin compressed by 1.9 percentage points to 21.5%.Free Cash Flow for the first half of 2026 experienced a sharp contraction, dropping 85.3% year-over-year to €24 million due to a €452 million working capital outlay and increased capital expenditures.
Revenue Breakdown by Segment and Region
Segment Breakdown
- Recorded Music (€2,516 million, 76.4% of Total Revenue):Represents recorded sound revenue, including physical format sales, digital downloads, subscription streaming, and licensing fees.Segment revenue grew 16.2% reported (8.7% adjusted).Subscription streaming revenue rose 16.6% to €1,368 million.Physical formats demonstrated strong performance, growing 15.9% to €342 million driven by vinyl demand in the US and Japan.Top sellers in the period included Taylor Swift, BTS, and Billie Eilish.
- Music Publishing (€616 million, 18.7% of Total Revenue): Represents income from the acquisition and licensing of rights to musical compositions. Segment revenue rose 9.8% reported (2.7% adjusted) to €616 million, supported by steady growth in synchronization rights across advertising, film, and television.
- Merchandising and Other (€167 million, 5.1% of Total Revenue):Covers artist merchandise, direct-to-consumer sales, and touring logistics. Revenue declined 10.7% year-over-year due to timing differences in major album release cycles and direct-to-consumer store inventory adjustments.
Regional Performance
- North America (~48% of Revenue):Remains UMG’s largest geographic market, benefiting from expansion in ad-supported and premium streaming tier monetization, as well as high-margin physical vinyl collector editions.
- Europe (~28% of Revenue):Showed moderate single-digit expansion, driven by steady subscription penetration across key markets like the UK, Germany, and France.
- Asia-Pacific (~15% of Revenue):Higher relative growth rates, boosted by physical physical sales in Japan and streaming expansion across Southeast Asia.
- Latin America & Rest of World (~9% of Revenue): High-growth emerging regional segment, showing double-digit streaming adoption despite low initial ARPU (Average Revenue Per User).
Quarter Changes, Key Focus for Next Quarter, and Future Outlook
Quarterly Dynamics and Changes
- Margin Compression:Adjusted EBITDA margin declined from 23.4% in Q2 2025 to 21.5% in Q2 2026. The compression stemmed from the lower-margin consolidation of Downtown Music Holdings, unfavorable repertoire mix costs, and ongoing legal defense expenditures regarding copyright enforcement.
- Cash Flow Contraction:Free Cash Flow fell to €24 million for H1 2026 from €163 million in H1 2025 due to working capital commitments of €452 million and a 91.3% jump in CapEx to €44 million.
Next Quarter Observation Points
- Free Cash Flow Normalization: Management guided for a seasonal reversal in working capital during H2 2026; tracking H3 operating cash generation will be crucial.
- Streaming 2.0 Monetization: Monitor price adjustments on DSPs (Digital Service Providers) like Spotify and Apple Music to assess whether ARPU gains offset slowing subscriber volume growth in mature territories.
- Downtown Integration Efficiency: Re-evaluating cost synergies to determine if the consolidated margins can recover toward the baseline target of 22-23%.
Future Outlook
UMG maintains long-term revenue growth expectations driven by global streaming expansion, monetization of high-value fan tiers (Superfan models), and generative AI licensing frameworks. Management expects working capital efficiency to recover in H2 2026, alongside shareholder return initiatives including an ongoing €500 million share buyback program.
Three-Month Share Price Movement and Market Drivers
Stock Price Movement
Over the last three months (late May 2026 to late August 2026), UMG shares (AMS: UMG) dropped significantly from around €19.80 to approximately €14.88, representing a decline of roughly 25%. The primary stock drop occurred on July 31, 2026, when the stock crashed 25.4% in a single trading session, falling from €19.35 to €14.44.
Market Drivers Behind the Movement
- Earnings Reaction:The sell-off was triggered by the Q2 2026 earnings report published on July 30, 2026. Although overall revenue grew 13.3%, investors reacted negatively to the flat Adjusted EBITDA (€674M) and margin compression (down 190 bps to 21.5%).
- Cash Flow Shock:The sharp drop in H1 2026 Free Cash Flow down to €24 million raised concerns over short-term liquidity generation and capital allocation efficiency.
- Ad-Supported Slowdown: Organic ad-supported streaming growth slowed to 1.7% in Q2, signaling macro advertising budget pressures across major streaming video and short-form video platforms.
Information Sources
- https://www.universalmusic.com/universal-music-group-n-v-reports-financial-results-for-the-second-quarter-and-half-year-ended-june-30-2026/
- https://www.universalmusic.com/universal-music-group-n-v-reports-financial-results-for-the-first-quarter-ended-march-31-2026/
- https://www.musicbusinessworldwide.com/universal-music-group-generated-3-39-billion-in-q1-up-8-1-yoy-driven-by-bts-olivia-dean-taylor-swift-and-more/
- https://www.investing.com/news/company-news/universal-music-q2-2026-slides-revenue-rises-margins-compress-93CH-4825809
- https://www.investing.com/equities/universal-music-nv-historical-data
Back to Uniuversal Music