Latest Quarterly Financial Results Summary (Q2 2026)
Telenor Group reported its second quarter 2026 results on July 16, 2026, delivering a softer financial performance due to transitional costs, increased competition in Norway, and macroeconomic headwinds in Asian operations.
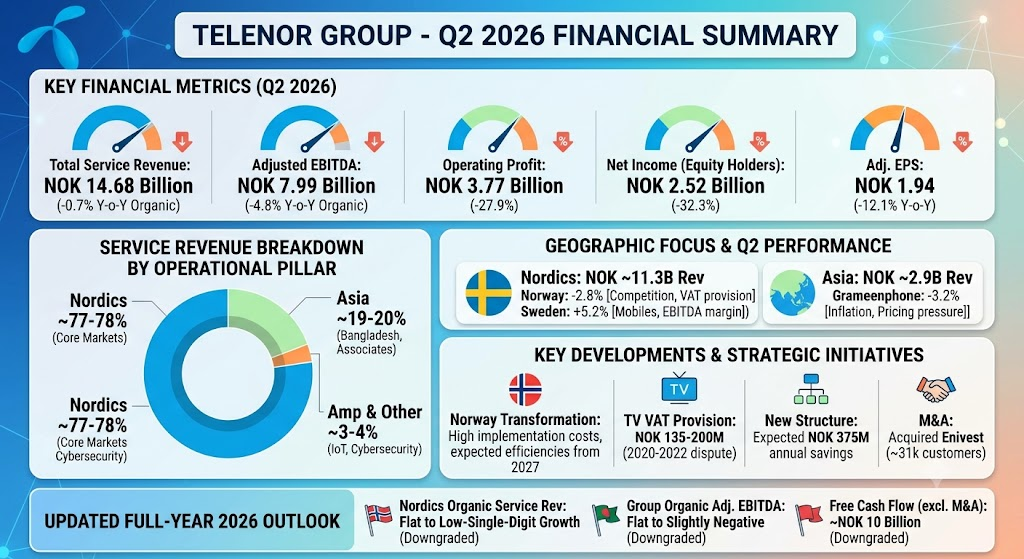
- Total Service Revenues:NOK 14,679 million, down 0.7% year-over-year on an organic basis (down from NOK 15,493 million in Q2 2025).
- Adjusted EBITDA:NOK 7,987 million, representing a 4.8% organic decline year-over-year (NOK 8,781 million in Q2 2025).
- Operating Profit:NOK 3,771 million, down 27.9% compared to NOK 5,230 million in Q2 2025.
- Net Income Attributable to Equity Holders:NOK 2,524 million, down 32.3% year-over-year.Adjusted net income was NOK 2,651 million.
- Adjusted Earnings Per Share (EPS): NOK 1.94, down 12.1% year-over-year (compared to NOK 2.21 in Q2 2025), missing market consensus estimates of NOK 2.09.
- Free Cash Flow (before M&A): NOK 1,815 million, an increase of 12.6% compared to NOK 1,612 million in Q2 2025.
- Capex-to-Sales Ratio:14.5% (excluding leases), an increase of 1.2 percentage points year-over-year.
- Leverage Ratio: Net debt to EBITDA ended at 1.4x, down significantly from 2.4x in the prior year, remaining well below the company’s long-term target corridor of 1.8x–2.3x.
Business Segment and Regional Revenue Breakdown
Telenor reports its commercial activities under three primary operational pillars: Telenor Nordics, Telenor Asia, and Telenor Amp (alongside Group functions and Other units). Service revenues remain the primary revenue indicator.
Official Operational & Regional Breakdown
- Telenor Nordics (~77-78% of Group Service Revenues): Represents Telenor’s core geographic focus across four fully owned business units.
- Norway (~37-39% of Group Service Revenues): The largest single market, offering nationwide mobile connectivity, fiber broadband, TV, and enterprise IT/cloud managed services. Service revenues declined 2.8% and adjusted EBITDA dropped 7.7% year-over-year, weighed down by an exceptional comparable period in Q2 2025, higher promotional intensity in consumer mobile, and a TV VAT provision covering 2020–2022.
- Sweden (~19-20% of Group Service Revenues):Provides mobile networks, fixed broadband, and enterprise solutions.Sweden stood out as a growth engine in Q2 2026, delivering 5.2% service revenue growth supported by 36,000 net mobile additions and achieving an adjusted EBITDA margin of 41.4% due to fixed network transformation and overhead discipline.
- Finland / DNA (~12-13% of Group Service Revenues): DNA provides mobile, high-speed fixed broadband, and digital entertainment services. Service revenues grew 2.1%, though EBITDA remained constrained by intense price competition and macroeconomic weakness among enterprise clients.
- Denmark (~8-9% of Group Service Revenues):Mobile telecommunications, 5G Fixed Wireless Access (FWA), and broadband services. Service revenues grew 3.5% through mobile price adjustments, although gross margin expansion was restrained by introductory discount dynamics.
- Telenor Asia (~19-20% of Group Service Revenues):
- Grameenphone (Bangladesh, Consolidated): Telenor owns 55.8% of Grameenphone, Bangladesh’s leading mobile operator. In Q2 2026, service revenues fell 3.2% (down 2.6% organically) and adjusted EBITDA decreased 6.0%, driven by consumer purchasing power erosion, elevated inflation, and aggressive price competition in mobile data packages.
- Associated Joint Ventures (Equity Accounted): Includes CelcomDigi in Malaysia and True Corporation in Thailand. In Q2 2026, net income contribution from associates and joint ventures stood at NOK 263 million.
- Telenor Amp & Other Units (~3-4% of Group Service Revenues):
- Encompasses adjacent software, cybersecurity, IoT connectivity (Telenor Connexion), media joint venture Allente, and Telenor Procurement Company (TPC). Telenor Amp delivered positive underlying momentum, though TPC faced a NOK 0.2 billion top-line reduction following a procurement contract adjustment from True Corporation.
Key Developments, Next Quarter Focus, and Future Outlook
Key Developments and Closures This Quarter
- TV VAT Dispute Provision: Telenor recognized an exceptional provision of approximately NOK 135-200 million in Norway concerning a multi-year value-added tax dispute over distributed TV news channels for 2020–2022, which directly weighed down reported service revenues and EBITDA.
- Transformation Execution and Peak Dual Costs:Management confirmed that 2026 marks peak implementation spend for four restructuring programs in Norway (IT simplification, cloud-native migration, customer service, and B2B modularity).Dual IT run-costs will begin rolling off in late 2026 and accelerate into 2027.
- Organizational Simplification:Telenor announced a simplified corporate structure taking effect in August 2026, projected to unlock NOK 375 million in annual structural operating cost savings starting in 2027 (NOK 300 million from group streamlining and NOK 75 million from downscaling regional operations in Asia).
- Strategic Fixed M&A:Telenor completed bolt-on regional fiber expansions, including the acquisition of Enivest in Norway (transaction value NOK 2.5 billion, adding ~31,000 fiber and broadband customers) to solidify Nordic fixed-line infrastructure dominance.
Next Quarter Observation Points
- Norway Back-Book Pricing Migration: Monitoring whether revised pricing tiers in the Norwegian consumer mobile and fiber subscriber base stick without triggering excessive churn, especially against lower promotional offerings.
- IT Transition Cost Tapering: Tracking whether second-half 2026 operating expenses start normalizing as duplicate platform maintenance costs wind down.
- Bangladesh Socio-Economic Recovery: Watching for ARPU stabilization and data usage volume recovery at Grameenphone amidst persistent macroeconomic inflation.
- Integration of Nordic Acquisitions: Observing synergy capture and regulatory approvals across acquired fixed broadband footprints (such as Enivest and GlobalConnect B2C assets).
Future Financial Guidance and Outlook
- Updated Full-Year 2026 Outlook:
- Telenor Nordics Organic Service Revenue Growth:Flat to low-single-digit (revised down from low-single-digit).
- Telenor Nordics Organic Adjusted EBITDA Growth:Flat to low-single-digit (lowered from low-to-mid single-digit).
- Group Organic Adjusted EBITDA:Flat to slightly negative (revised down from flat-to-low single-digit).
- Free Cash Flow (before M&A):Around NOK 10 billion (lowered from the previous guidance band of NOK 10–11 billion).
- Nordics Capex-to-Sales:Maintained at around 14% (excluding leases).
- Mid-to-Long-Term Ambitions (2028–2030):Free cash flow before M&A (excluding associates and incremental spectrum) is guided to expand to NOK 12–13 billion by 2028 and reach NOK 14–15 billion by 2030, with Nordic capex-to-sales tapering to below 13% by 2028 and 11–12% by 2030. Management reiterated progressive dividend growth per share alongside its multi-year NOK 15 billion buyback plan.
Share Price Performance Over the Past Three Months
Across June to early September 2026, Telenor’s equity price (TEL.OL / US ADR: TELNY) experienced noticeable downward volatility followed by range-bound consolidation.
- Price Trajectory: In early-to-mid June 2026, shares traded firmly between NOK 150.00 and NOK 157.00 (TELNY around $15.68–$15.74). The stock underwent a steep drop on July 16, 2026, sliding over 11% in a single session to hit lows near NOK 132.00–NOK 133.00 (TELNY touching $13.30). Through August and early September 2026, the stock has traded sideways, hovering between NOK 132.00 and NOK 134.50 (TELNY around $14.30–$14.50).
- Primary Market Drivers:
- Q2 Earnings Miss and Guidance Cut: The primary catalyst for the sharp July sell-off was the simultaneous shortfall in Q2 EBITDA and adjusted EPS, alongside management’s downward revision of both Nordic revenue expectations and full-year Free Cash Flow guidance to ~NOK 10 billion.
- Heightened Competitive Drag: Investors reacted negatively to margin erosion in Norway caused by competitive price wars in unlimited mobile data tiers, coupled with sustained operational headwinds at Grameenphone in Bangladesh.
- Valuation Support and Share Buybacks: The stabilization from late July through September was anchored by Telenor’s disciplined capital return framework, including an attractive dividend yield above 7%, a comfortable balance sheet leverage ratio of 1.4x, and the ongoing execution of its share buyback program.
Sources
- https://www.telenor.com/investors/
- https://www.telenor.com/binaries/investors/reports-and-information/quarterly/2026/Report-Q2-2026.pdf
- https://www.telenor.com/investors/reports-and-information/financial-outlook/
- https://www.telenor.com/investors/reports-and-information/analyst-coverage-and-consensus/pre-estimate-items/
- https://www.investing.com/equities/telenor-historical-data
- https://www.investing.com/news/company-news/telenor-q2-2026-slides-transformation-costs-weigh-on-results-93CH-4794956
- https://scanx.trade/stock-market-news/companies/telenor-q2-eps-0-21-misses-estimates-on-sales-decline/45731786
Back to Telenor