
Market Position and Market Share
Stellantis N.V. is currently the 4th largest global automaker by volume, behind Toyota, Volkswagen Group, and Hyundai Motor Group. It manages a portfolio of 14 iconic automotive brands, including Jeep, Ram, Peugeot, Citroën, Fiat, Opel, Alfa Romeo, and Maserati.
- Global Ranking: 4th largest automotive manufacturer worldwide by annual volume (~5.5 million to 6.0 million vehicles delivered annually).
- European Market Position (EU30): Holds 2nd place with a 16.7% market share (expanding to 17.4% when including partner Leapmotor). It maintains the #1 market position in the EU A/B segments (compact cars) and Light Commercial Vehicles (LCV) under the Stellantis Pro One banner with a 28.7% market share.
- North American Market Position: Holds 4th place (behind GM, Toyota, and Ford) with a market share around 8.5%–9.5% in the U.S., anchored by Ram truck and Jeep SUV lines.
- South American Market Position: Holds 1st place in regional leadership with a 19.1% market share, dominating key markets like Brazil (25.6%) and Argentina (26.0%).
Supply Chain Analysis and Key Suppliers
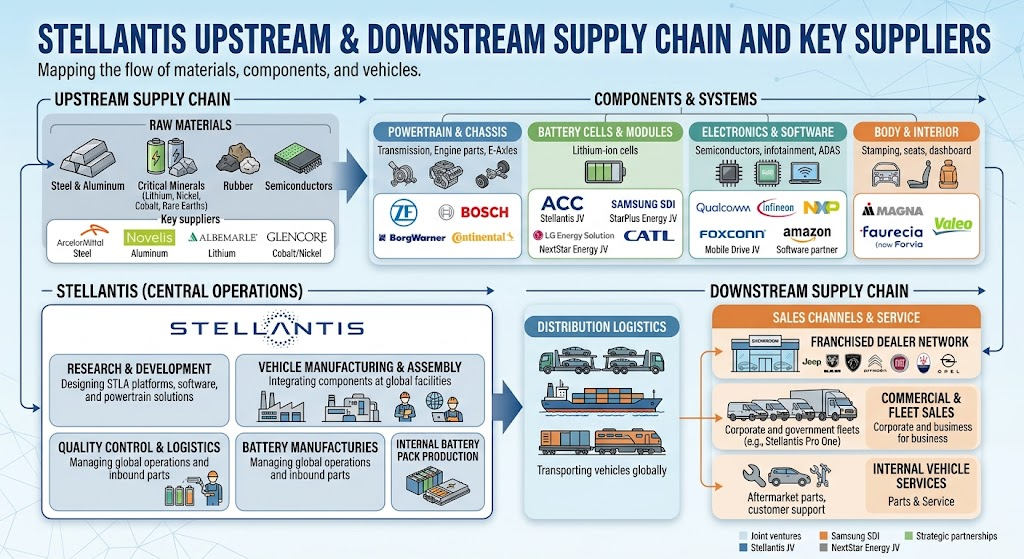
Stellantis relies on a hybrid supply chain model, combining joint ventures for critical electrification components with traditional Tier-1 automotive partnerships.
- Upstream Supply Chain (Raw Materials & Critical Components):
- EV Battery Cell Partners: ACC (Automotive Cells Company – a joint venture between Stellantis, TotalEnergies/Saft, and Mercedes-Benz), Samsung SDI (StarPlus Energy JV in North America), LG Energy Solution (NextStar Energy JV in Canada), and CATL (LFP battery supply agreement).
- Electric Motors & E-Axles: Emotors (a 50/50 joint venture with Nidec Leroy-Somer) produces electric traction motors for STLA platforms.
- Semiconductors & Electronics: Key supply agreements with Qualcomm (Snapdragon Digital Chassis), Mobileye (ADAS/autonomous driving), and Infineon Technologies.
- Infotainment & Software: Foxconn (Mobile Drive JV for smart cockpits) and Amazon (software & cloud services integrations).
- Downstream Supply Chain (Manufacturing & Distribution):
- Operations span across 30+ manufacturing facilities globally (notably across Europe, North America, and South America).
- Multi-Energy Modular Platforms: Manufacturing is built around four global EV-native architectures: STLA Small, STLA Medium, STLA Large, and STLA Frame.
- Distribution: Directly managed dealer networks, commercial fleet distribution, and retail franchise arrangements globally.
- Key Tier-1 Suppliers:
- Bosch, Continental AG, ZF Friedrichshafen, Magna International, Denso, Valeo, and Forvia (Faurecia).
Competitor Analysis
Stellantis faces direct competition from global legacy OEMs as well as emerging EV manufacturers. Key peers include Volkswagen Group, General Motors (GM), and Toyota Motor Corporation.
- Technical Comparison:
- Platform Strategy: Stellantis employs multi-energy modular platforms (STLA Medium/Large/Frame) designed to support ICE, Hybrid, and BEV powertrains on the same assembly line. This offers high operational flexibility compared to Volkswagen’s BEV-dedicated MEB architecture or GM’s Ultium platform.
- Software & China Integration: Unlike GM or Ford, Stellantis acquired a ~20% strategic stake in Chinese EV automaker Leapmotor, establishing the Leapmotor International JV to export and manufacture affordable Chinese-developed EVs outside China.
- Electrification Execution: Offers a strong commercial vehicle lineup and hybrid presence in Europe, but trails Tesla and Chinese OEMs (e.g., BYD) in software integration and dedicated global BEV market share.
- Financial Comparison:
- Valuation (Market Cap): Stellantis trades at a significantly lower market capitalization (~$15B–$22B) compared to GM (~$55B), Volkswagen (~$50B), and Toyota (~$250B+).
- Valuation Multiples: Stellantis trades at lower Price-to-Earnings (P/E ~3.5x–7.5x) and Price-to-Sales (P/S ~0.08x–0.15x) multiples compared to peers, reflecting market caution over inventory adjustments and North American margin compression.
- Profit Margins: Historically maintained high Adjusted Operating Income (AOI) margins (10%–12%) due to merger synergy execution between PSA and FCA, though cyclical inventory challenges in North America have compressed recent operational cash flow relative to GM and Toyota.
Sources
- https://www.stellantis.com
- https://www.media.stellantis.com/em-en/corporate/press/stellantis-ends-the-first-half-of-2026-with-a-3-8-increase-in-eu30-vehicles-sales
- https://www.media.stellantis.com/es-es/corporate/press/stellantis-reports-q2-2026-financial-results
- https://seekingalpha.com/symbol/STLA/peers/comparison
- https://zh.wikipedia.org/wiki/%E6%96%AF%E6%B3%B0%E8%98%AD%E8%92%82%E6%96%AF
Back to Stellantis