
Market Position and Market Share
Sony Group Corporation holds leading positions across multiple global entertainment, semiconductor, and consumer hardware sectors:
- Image Sensors(I&SS): Sony is the global leader in CMOS Image Sensors(CIS), controlling approximately 54% to 55% of global market revenue in 2023–2024, maintaining a significant lead over Samsung System LSI(~18–20%) and OmniVision(~10–11%).
- Gaming(G&NS): Sony’s PlayStation 5 holds the dominant share in current-generation home consoles, capturing approximately 65% to 70% of current-gen unit market share worldwide against Microsoft Xbox Series X/S and outperforming Xbox hardware sales by roughly a 3:1 margin globally.
- Music Publishing and Recorded Music: Sony Music Entertainment(SME) ranks #2 globally in recorded music market share at approximately 20% to 22%, trailing Universal Music Group(~30%–32%) and leading Warner Music Group(~15%–17%). Through Sony Music Publishing, it ranks #1 globally in music publishing.
- Digital Cameras: Sony holds the #2 spot in total digital still cameras by volume(~26%–27%), trailing Canon(~46%–47%), but holds the #1 or contested #2 position in high-end mirrorless full-frame cameras.
- Theatrical Motion Pictures: Sony Pictures Entertainment(SPE) generally commands between 9% and 12% of the North American domestic box office, fluctuating between the #4 and #5 major studio rank alongside Disney, Universal, and Warner Bros. Discovery.
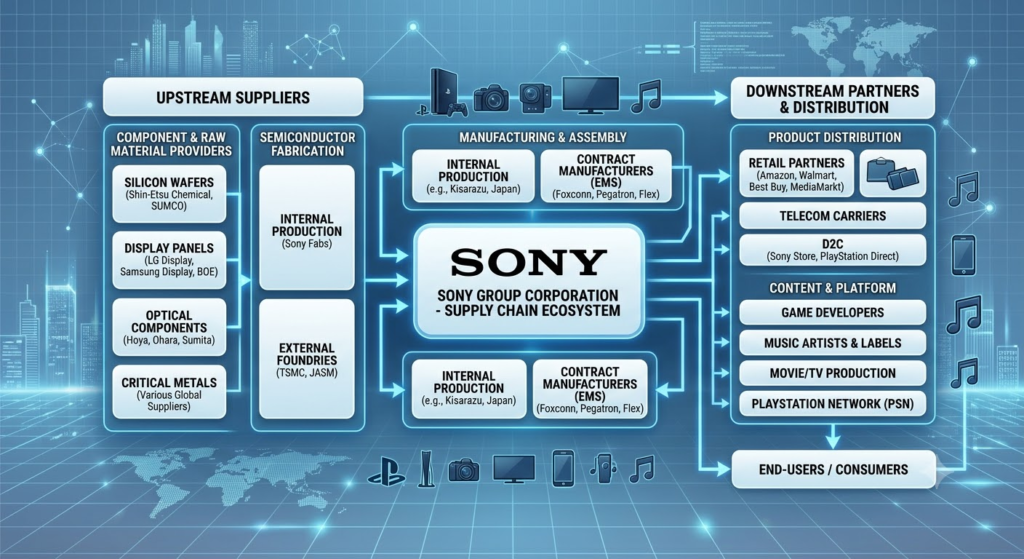
Upstream and Downstream Supply Chain Analysis & Key Suppliers
Upstream Supply Chain
- Semiconductor Foundries & Wafer Manufacturing: For its CMOS image sensors, Sony manufactures pixel and logic layers using its proprietary fabs(Kumamoto, Nagasaki, Yamagata, and Oita), while outsourcing logic die fabrication and advanced processes to TSMC(Taiwan Semiconductor Manufacturing Co.) and JASM(Japan Advanced Semiconductor Manufacturing, in which Sony is an equity partner and anchor customer).
- Silicon Wafer Substrates: Critical raw silicon wafers for CIS and discrete components are supplied by Shin-Etsu Chemical and SUMCO Corporation.
- Gaming SoC and Memory: The custom APU driving the PlayStation 5 is architected with and fabricated through AMD, manufactured on TSMC’s 7nm/6nm FinFET nodes. GDDR6 high-speed memory and storage flash are procured from Micron Technology, Samsung Electronics, and Kioxia.
- Displays: High-end OLED and Mini-LED display panels for Sony BRAVIA televisions and Xperia smartphones are sourced from LG Display(WOLED), Samsung Display(QD-OLED), and BOE Technology.
- Optical Glass and Mechanics: Precision glass molding and lens components for Alpha camera systems rely on Hoya, Ohara, and Sumita Optical Glass.
Downstream Supply Chain & Value Chain Distribution
- Contract Manufacturing(EMS/ODM): Major hardware assembly for PlayStation consoles and consumer electronics is handled through EMS partners including Foxconn(Hon Hai Precision Industry) and Pegatron Corporation, alongside Sony’s automated domestic facility in Kisarazu.
- Retail & Direct-to-Consumer(D2C): Distribution operates through multi-tiered channels including major retail distributors(Amazon, Best Buy, Walmart, MediaMarkt), direct e-commerce(PlayStation Direct, Sony Store), and telecommunication carriers for mobile devices.
- Digital Ecosystem & Cloud Delivery: PlayStation Network(PSN) operates as a closed-loop digital distribution platform collecting a platform fee(~30%) on third-party software and microtransactions. Sony utilizes cloud hosting partnerships with Amazon Web Services(AWS) and Microsoft Azure for backend multiplayer and cloud game streaming infrastructure.
Competitor Analysis: Technical and Financial Comparison
Gaming & Network Services: Sony(PlayStation) vs. Microsoft(Xbox) vs. Nintendo
- Technical Comparison: Sony focuses on custom system architecture(high-bandwidth PCIe 4.0 NVMe SSD custom controller with ~5.5 GB/s raw throughput, Tempest 3D Audio, and DualSense haptic feedback/adaptive triggers) designed to optimize high-fidelity, narrative-driven first-party exclusives. In contrast, Microsoft emphasizes backward compatibility, cross-platform cloud streaming(Xbox Cloud Gaming), and raw compute with unified DirectX APIs. Nintendo diverges technically by prioritizing hybrid mobility, lower thermal dissipation, and proprietary ARM architecture rather than bleeding-edge graphical compute.
- Financial Comparison: Sony’s G&NS division generates substantial hardware and network service revenue(exceeding 4 trillion yen annually), though operating margins in gaming fluctuate between 6% and 9% due to console BOM hardware cycles and studio acquisition amortizations. Microsoft leverages enterprise software cash flows to subsidize multi-game subscription infrastructure(Xbox Game Pass) and absorbed large-scale CapEx for acquisitions(Activision Blizzard for $68.7B). Nintendo maintains significantly higher operating margins(regularly between 25% and 35%) due to profitable hardware unit economics from launch and sustained high-margin software sales.
Semiconductor Solutions: Sony vs. Samsung System LSI vs. OmniVision
- Technical Comparison: Sony maintains an architectural advantage via stacked CMOS sensor technology, pioneering two-layer transistor pixel architectures(separating photodiodes and transfer transistors) that double saturation signal levels, widen dynamic range, and reduce dark noise. Samsung competes aggressively on pixel shrink technologies(ISOCELL 0.6μm–0.8μm nodes) to achieve ultra-high megapixel counts(up to 200MP) tailored for nona-binning smartphone cameras, whereas Sony targets larger physical pixel areas, low-light sensitivity, and fast readout speeds for professional mobile photography, industrial machine vision, and automotive ADAS.
- Financial Comparison: Sony’s Imaging & Sensing Solutions(I&SS) generates operating profit margins typically ranging from 12% to 18%, driven by premium pricing for large optical format sensors supplied to Tier-1 smartphone OEMs(including Apple). Samsung’s System LSI operates within a broader semiconductor conglomerate, facing cyclical memory volatility and lower standalone CIS pricing realization compared to Sony’s high ASP mix.
Information Sources
- https://www.sony.com/en/SonyInfo/IR/library/presen/er/
- https://www.counterpointresearch.com/insights/global-smartphone-image-sensor-market-share/
- https://www.yolegroup.com/industry-news/status-of-the-cmos-image-sensor-industry-2024/
- https://www.vgchartz.com/
- https://www.sec.gov/edgar/searchedgar/companysearch
- https://www.ifpi.org/resources/
Back to Sony