Market Position and Market Share
ING Group is a Global Systemically Important Bank (G-SIB) with total assets exceeding €1.3 trillion and a customer base of over 40 million worldwide.
1. Core Markets: Leadership in the Benelux Region
- Largest Bank in the Netherlands: ING holds a 37.06% market share by total assets in its home market of the Netherlands, solidifying its rank as the leading financial institution ahead of Rabobank and ABN AMRO.
- Benelux Market Leader: Maintains dominant market position and deep brand penetration across retail and commercial banking segments in the Netherlands, Belgium, and Luxembourg.
2. Challenger Markets: Pioneer in Direct & Digital Banking
- Top Direct Bank in Germany: Operating as ING-DiBa, the group commands a substantial market share in personal deposits and residential mortgages through a pure online banking model.
- European Digital Banking Brand: Acts as a leading digital-first challenger in markets such as Spain, Italy, Poland, and Australia, continually capturing market share in online deposits and digital retail users.
3. Wholesale Banking & Green Finance: Global Scale
- Cross-Border Corporate & Trade Finance: With an active presence in over 40 countries, ING provides trade financing, transaction banking, and syndicated loans to large multinational corporations across Europe, the Americas, and Asia.
- Leader in Sustainable Finance: Utilizing its proprietary Terra Approach, ING consistently ranks among the global leaders in underwriting green bonds, structuring sustainability-linked loans (SLLs), and climate transition financing.
Sources
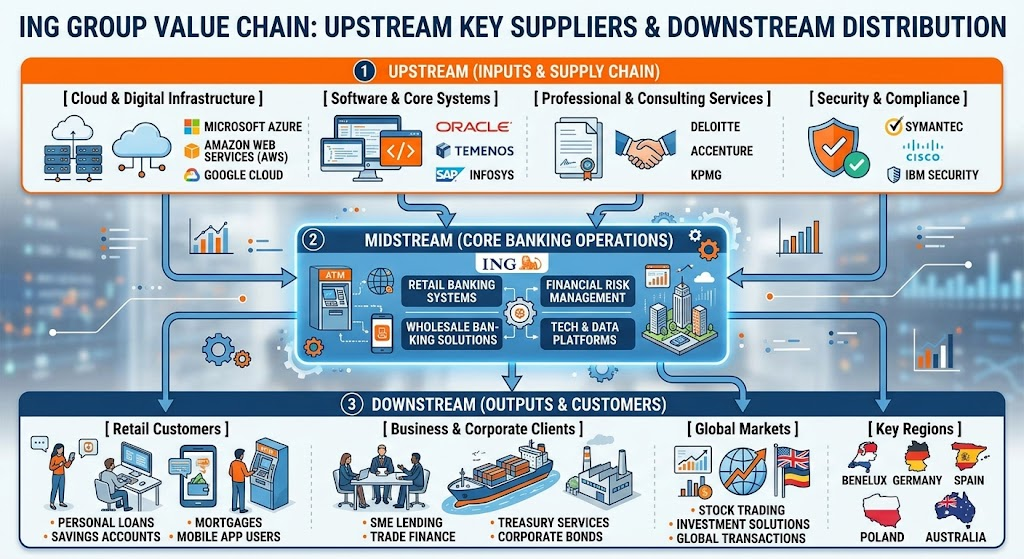
As a financial institution, ING Group’s supply chain differs from traditional manufacturing. It centers on information technology services, data and cloud infrastructure, professional consulting, and operational outsourcing.
1. Supply Chain Overview
ING’s Procurement and Vendor Management framework primarily spans three domains:
- IT & Digital Infrastructure: Core technologies supporting its direct banking model and hybrid-cloud architecture, including cloud computing, databases, analytics, and cybersecurity solutions.
- Fintech & Enterprise Software: Core banking engines, Regulatory Technology (RegTech), Anti-Money Laundering (AML) monitoring, and Enterprise Resource Planning (ERP) systems.
- Professional Services & Operations: Strategic consulting, Systems Integration (SI), and operational process management.
In line with its corporate standards, ING implements a KYS (Know Your Supplier) framework and a dedicated Supplier Sustainability Code to ensure key vendors meet strict ESG, carbon footprint, human rights, and cybersecurity compliance benchmarks.
2. Key Vendors and Strategic Partners
1. Cloud & Infrastructure
- Microsoft (Azure / Windows 365): Provides public cloud infrastructure and enterprise digital workspace solutions across ING’s global operations.
- VMware: Delivers virtualization technology powering ING’s internal private cloud environments.
- Oracle: Provides core database infrastructure and enterprise financial management applications.
2. Data, AI & RegTech
- Databricks & Snowflake: Support data engineering, advanced analytics, and centralized data governance frameworks.
- Quantexa: Enables AI-driven network analytics for Know Your Customer (KYC) and Anti-Money Laundering (AML) risk monitoring.
- Temenos: Powers core banking and wealth management operations in select regional markets (e.g., ING Belgium).
- Thought Machine: Cloud-native core banking platform vendor backed by ING’s venture arm, ING Ventures.
3. Enterprise Applications & Procurement
- Salesforce: Customer Relationship Management (CRM) and multi-channel engagement platform.
- SAP Ariba: Drives ING’s global procurement management and vendor onboarding workflows.
- ServiceNow: Manages IT service automation and enterprise operational workflows.
Sources
- https://ing.com/sustainability/our-progress/working-with-suppliers
- https://ing.com/news/2021/12/ing-invests-in-cloud-banking.html
- https://www.rfp.wiki/financial-services-banking-fintech/banks-financial-institutions/ing
Competitive Analysis: Financial and Technical Dimensions
A comprehensive competitive analysis of ING Group relative to European peers (e.g., BNP Paribas, Banco Santander, UBS) and emerging Neobanks highlights its financial performance alongside its core technology architecture.
1. Financial Performance Analysis
ING’s lean, direct-banking-focused operating model shapes its distinct financial profile compared to traditional European incumbents:
| Financial Metric | ING Group | BNP Paribas | Banco Santander | Strategic Context & Analysis |
| Cost-to-Income Ratio | 49% – 53% | ~58% – 60% | ~44% – 46% | Strength: Consistently outperforms traditional branch-heavy peers due to its scalable, branchless/digital-first structure. |
| Return on Tangible Equity (RoTE) | 15% – 17% | ~11% – 12% | ~15% – 16% | Strength: High capital efficiency driven by a digital asset-light model that accelerates shareholder return. |
| CET1 Ratio (Capital Adequacy) | 13.1% – 13.6% | ~12.8% – 13.0% | ~12.3% – 12.5% | Strength: Maintains strong regulatory capital buffers above target thresholds, facilitating regular share buyback programs. |
| Net Interest Margin (NIM) | ~1.36% – 1.42% | ~1.10% – 1.25% | ~2.10% – 2.30% | Weakness: Trailing consumer-loan-heavy banks like Santander; vulnerable to margin compression in lower interest rate environments. |
| Fee Income Ratio | ~20% – 22% | ~35% – 40% | ~25% – 30% | Weakness: A smaller wealth management and investment banking footprint leaves fee income less capable of hedging Net Interest Income (NII) fluctuations. |
Key Financial Takeaways
- High Operational Efficiency: ING’s low physical footprint across Challenger markets helps keep operating costs well-disciplined, generating industry-leading RoTE metrics in European banking.
- NII Sensitivity: With a higher structural dependence on interest income, rate cuts by the European Central Bank (ECB) present a higher margin risk to ING than to peers with larger investment banking or wealth management fee streams.
2. Technology & Architecture Analysis
ING stands out among incumbent European banks due to its early adoption of digital-native architectures and direct-banking platforms.
Key Technical Advantages
- Touchpoint Platform & Modular App Strategy:ING’s “Touchpoint” strategy standardizes core banking APIs and user interfaces across multi-country operations. This modular design lowers marginal software costs and shortens product release cycles globally.
- Next-Gen Cloud-Native Core Banking:By investing in and partnering with Thought Machine, ING is gradually replacing legacy mainframes with cloud-native core banking engines, enabling microservices-based account management and high transaction concurrency.
- Data Lakehouse & AI-Driven Compliance:Using centralized architectures like Databricks alongside graph-AI engines like Quantexa, ING processes real-time Know Your Customer (KYC) and Anti-Money Laundering (AML) monitoring, reducing manual compliance overhead.
Competitive Positioning Matrix
- Vs. Traditional Legacy Banks (BNP Paribas, Deutsche Bank, Citi):
- Advantage: Lower legacy branch overhead, lower Customer Acquisition Cost (CAC), and faster deployment of digital consumer features.
- Disadvantage: Less specialized legacy infrastructure for complex capital markets and ultra-high-net-worth structured products.
- Vs. Digital Neobanks (Revolut, N26, Monzo):
- Advantage: Backed by a full banking license, strong balance sheet management, higher consumer trust, and substantial deposit pools.
- Disadvantage: Older legacy systems in select markets require ongoing modernization, making new niche feature rollouts slightly slower than pure FinTech startups.
Back to ING