Here is the summary of ING Group’s Q2 2026 financial results:
1. Financial Performance Overview
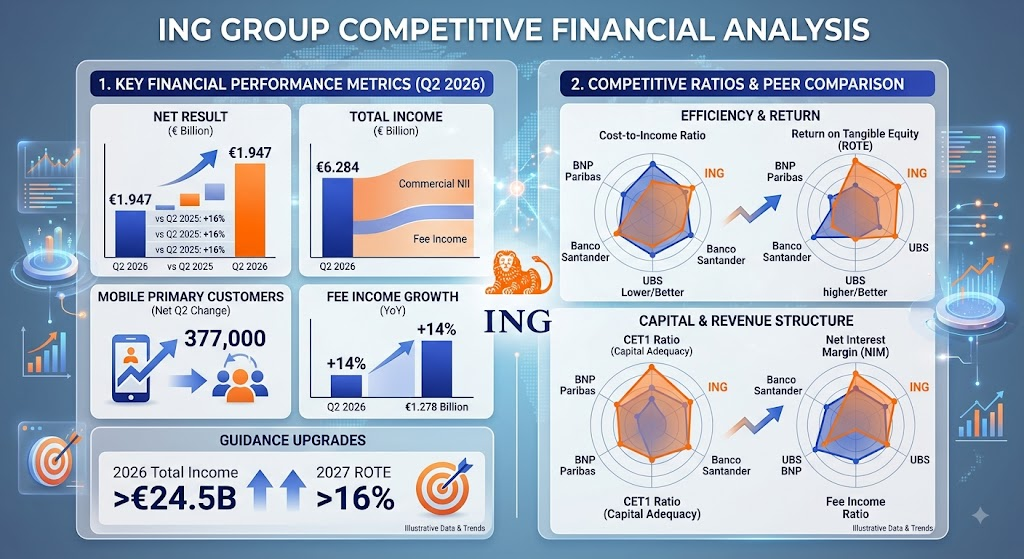
- Net Result: Reached €1.947 billion, reflecting strong profitability across business lines.
- Growth Drivers: Driven by accelerated growth in customer assets (deposits and lending) as well as sustained fee income performance.
2. Customer & Operational Highlights
- Digital Customer Growth: Added 377,000 net new Mobile Primary Customers in the single quarter.
- Key Growth Markets: Strong performance led by the Netherlands, Germany, and Spain.
3. Capital & Strategy Execution
- Capital Returns: Executing the share buyback programme to optimize capital structure and enhance shareholder returns.
- ESG Standing: Maintained an MSCI ESG Rating of AAA.
Based on ING Group’s Q2 2026 official financial report, total income reached €6,284 million. The revenue structure can be categorized by Operating Segments and Revenue Breakdown (Product/Income Streams):
1. By Operating Segment
ING operates primarily across three core business segments:
| Business Segment | Estimated Revenue Share | Core Business & Recent Performance |
| Retail Banking | ~60% – 63% | The largest revenue contributor. Serves retail consumers and SMEs (Business Banking), providing mortgages, consumer loans, daily deposits, credit cards, and investment products. Performance was driven by strong mortgage and deposit growth in the Netherlands, Germany, Italy, and Australia. |
| Wholesale Banking | ~35% – 38% | Serves large multinational corporations and financial institutions. Offers corporate syndicated loans, trade finance, working capital solutions, transaction banking, and capital market advisory/underwriting. Shows strong fee income growth alongside an ongoing capital-light transition. |
| Private Banking | ~2% – 3% | ING’s dedicated wealth management segment for high-net-worth individuals, providing tailored wealth planning, asset management, and investment advisory. Fee income in this segment grew by 34% YoY. |
2. By Revenue Stream & Product Type
Categorized by income source for Q2 2026 (Total Income: €6,284 million):
Commercial Net Interest Income (NII)
- Share of Total Income: ~66.4% (€4,174 million)
- Description: Represents net interest spread generated across banking products, including residential mortgages, consumer lending, and corporate working capital loans, minus interest paid on customer deposits and wholesale funding.
Net Fee & Commission Income
- Share of Total Income: ~20.3% (€1,278 million)
- Description: Includes fee revenues from investment products (Assets under Management), brokerage services, payment and credit card transactions, as well as corporate advisory and bond underwriting fees in Wholesale Banking. Serves as a key driver for revenue diversification.
Investment & Other Income
- Share of Total Income: ~13.3% (€832 million)
- Description: Covers Financial Markets trading revenue, foreign exchange and derivatives transactions, asset disposals, and Treasury accounting adjustments.
Based on ING Group’s Q2 2026 financial disclosures, here are the key highlights, metrics to watch, and forward-looking guidance:
1. Key Developments This Quarter (Q2 2026)
- Beat Expectations Across Financials: Net result reached €1,947 million (up 16% YoY), topping analyst consensus. Total income grew 10% YoY to €6,284 million, underpinned by strong volume growth and a 14% YoY jump in fee income to €1,278 million.
- Accelerated Digital Primary Customer Growth: Added 377,000 net new Mobile Primary Customers in Q2 alone, led by primary market momentum in the Netherlands, Germany, and Spain.
- Strategic Expansion in Private Banking: Announced a strategic stake acquisition in Spanish wealth manager Singular Bank (~40% equity) to strengthen its footprint in European wealth management.
- Upgraded Full-Year and Mid-Term Guidance:
- 2026 Total Income: Upgraded to >€24.5 billion (from >€24.0 billion).
- 2026 Commercial NII: Raised to €16.8 billion – €17.0 billion.
- 2026 Fee Income: Target reached €5.0 billion (one year ahead of schedule).
- Return on Tangible Equity (ROTE): Raised to >15% for 2026 and >16% for 2027.
2. Key Metrics to Watch Next Quarter
- ECB Rate Cuts & Net Interest Margins (NIM): Rate policy shifts from the European Central Bank (ECB) could place pressure on commercial lending margins. Observers will monitor if deposit growth and volume expansion offset narrowing margins.
- Fee Income Sustainability: Tracking whether double-digit fee growth in retail investment products and transaction services continues as a hedge against interest rate fluctuations.
- Capital Returns & Share Buybacks: Progress on the ongoing €1.0 billion share buyback program alongside the interim cash dividend payout (€0.40 per share).
- Credit Quality & Cost of Risk: Monitoring provisioning and non-performing loan trends amid broader European macroeconomic conditions (Cost of risk remained low at 15 bps in Q2).
3. Future Outlook
- Elevated Target Trajectory: Total income for 2027 is projected to surpass >€26.0 billion, supported by operating cost discipline targeting ~€13.0 billion by 2027.
- Capital-Light Transition: Continued pivot towards fee-generating, capital-efficient businesses across Private Banking and Wholesale Banking.
- Sustainability Mobilization: Progressing under the Terra Approach, with sustainable volume mobilization reaching €86.5 billion in 1H 2026 while maintaining its AAA MSCI ESG rating.
Sources
- https://ing.com/news/press-releases/2q2026-ing-press-release.html
- https://www.investing.com/news/company-news/ing-q2-2026-slides-accelerated-growth-drives-upgraded-outlook-93CH-4822670
- https://www.globalbankingandfinance.com/ing-hikes-full-year-guidance-quarterly-profit-beat/
- https://www.marketbeat.com/instant-alerts/ing-group-q2-earnings-call-highlights-2026-07-30/
Back to ING