
Market Position and Market Share
Hitachi, Ltd. is a global industrial, energy, and digital infrastructure conglomerate that has pivoted from traditional hardware manufacturing into an integrated Operational Technology(OT), Information Technology(IT), and industrial equipment leader. For FY2025(ended March 31, 2026), consolidated revenue reached ¥10,586.7 billion(up 8% YoY), with an adjusted EBITA of ¥1,311.4 billion(12.4% margin) and net income of ¥802.3 billion.
The company’s core market shares and industry positions span three primary sectors:
- Hitachi Energy(Power Grids): Hitachi ranks #1 globally in power transmission and distribution equipment, reinforced by its full integration of ABB’s Power Grids division. In the High-Voltage Direct Current(HVDC) transmission systems and converter station market, Hitachi holds an estimated global market share of 30% to 35%, operating as the dominant leader ahead of Siemens Energy and GE Vernova. Hitachi Energy maintains an order backlog of approximately $47.6 billion.
- Digital Systems & Services(DSS): DSS generated approximately ¥2.95 trillion in revenue. Hitachi holds a top-3 market share in Japan for enterprise IT systems integration, mission-critical financial systems, and public infrastructure digitalization(alongside NTT DATA and Fujitsu). Globally, its digital engineering subsidiary, GlobalLogic, ranks among the top tier of pure-play product development services, while Hitachi Vantara ranks among top global enterprise data storage providers.
- Rail Mobility: Following the acquisition of Thales’ Ground Transportation Systems(GTS), Hitachi Rail holds an estimated top-4 global position in rolling stock and rail signaling systems, directly trailing CRRC, Alstom, and Siemens Mobility.
- Industrial & Connective Industries: Hitachi maintains leading market positions in high-speed elevators(holding a top-3 position in East Asia) and semiconductor CD-SEM metrology tools through Hitachi High-Tech(controlling over 60% global market share in critical dimension scanning electron microscopes).
Supply Chain Analysis and Key Suppliers
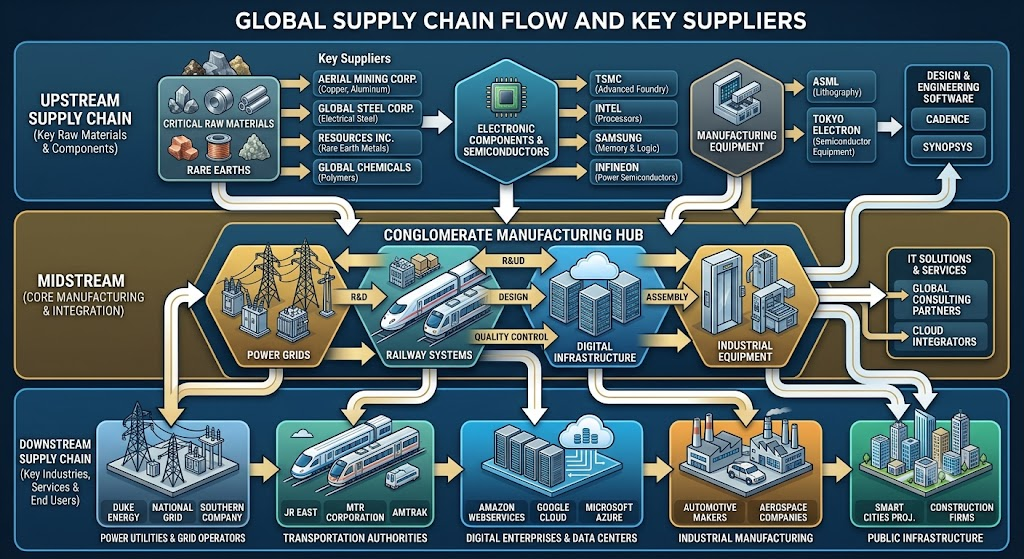
Hitachi operates a complex multi-tier supply chain spanning industrial raw materials, advanced electronics, mechanical sub-assemblies, and specialized software components.
1. Upstream Inputs & Key Suppliers
- Electrical Steel & Conductors: Hitachi Energy requires massive quantities of Grain-Oriented Electrical Steel(GOES) and high-conductivity copper for power transformers and grid reactors. Key suppliers include Nippon Steel, JFE Steel, Baosteel, and specialty copper fabricators. Global lead times for high-grade GOES exceed 18 to 24 months, making long-term supply volume agreements critical.
- Semiconductors & Power Modules: For HVDC converter stations, high-voltage switchgear, and railway traction inverters, Hitachi utilizes Silicon Carbide(SiC) and Insulated-Gate Bipolar Transistor(IGBT) power modules. While Hitachi manufactures selected proprietary semiconductors in-house, it sources merchant silicon and microcontrollers from Infineon Technologies, STMicroelectronics, and Renesas Electronics.
- Computing & Cloud Infrastructure: For its digital and Lumada solutions, Hitachi partners with Nvidia(for industrial edge AI and computing platforms) and procures enterprise server silicon from Intel and AMD, while relying on public cloud infrastructure providers(AWS, Microsoft Azure, Google Cloud).
- Industrial Castings & Structural Steels: Hitachi Rail and Connective Industries procure heavy steel structures, bogies, and forged aluminum components from Japanese and European metallurgic specialists.
2. Midstream Manufacturing & Value Addition
Hitachi retains critical manufacturing steps in-house to protect proprietary engineering IP. This includes transformer winding, high-voltage test bays, HVDC valve assembly, rolling stock aluminum car-body shell fabrication, and elevator traction machinery. Sub-assemblies like electronic printed circuit board assemblies(PCBAs) and wire harnesses are dual-sourced across automated production hubs in Japan, Sweden, Switzerland, the United States, and India.
3. Downstream Distribution & Integration
Hitachi’s downstream channel is predominantly B2B and B2G direct engineering sales:
- Utilities & Grid Operators: Direct turn-key engineering, procurement, and construction(EPC) contracts with national and regional utilities(e.g., TenneT, National Grid, RTE, American Electric Power).
- Rail Transit Authorities: Multi-year rolling stock supply and long-term rail maintenance contracts(e.g., Trenitalia, UK Department for Transport, JR East).
- Enterprises & Hyperscalers: Direct sales of high-voltage power substations and modular transformers directly to data center operators, alongside enterprise IT modernization contracts.
Competitor Analysis: Technical and Financial Comparison
Hitachi competes primarily against specialized industrial and electrical conglomerates: Siemens AG / Siemens Energy, GE Vernova, Schneider Electric, and Alstom.
1. Technical Capabilities Comparison
- Hitachi vs. Siemens Energy & GE Vernova(Grid Infrastructure): Hitachi Energy holds an architectural edge in Voltage Source Converter(VSC) HVDC systems with its modular multi-level converter(MMC) platform. While Siemens Energy possesses equivalent HVDC capabilities, Hitachi maintains broader integrated transformer capacity across high-voltage classes(765kV+). Unlike GE Vernova and Siemens Energy, Hitachi divested its traditional gas turbine and thermal power generation operations(transferred to Mitsubishi Power), reducing cyclical thermal equipment exposure and focusing purely on grid connectivity and transmission.
- Hitachi vs. Schneider Electric(Automation & OT/IT Convergence): Schneider Electric leads in low-to-medium voltage switchgear and factory energy management. However, Hitachi differentiates by combining deep heavy-industrial engineering(OT) with end-to-end digital software engineering(IT) via GlobalLogic and its Lumada framework, enabling edge-to-cloud analytics on massive physical grid and rail assets.
- Hitachi vs. Alstom & Siemens Mobility(Rail Systems): Hitachi Rail’s technical strength lies in aluminum high-speed train manufacturing(Shinkansen platform) and European Train Control System(ETCS) signaling acquired from Thales GTS, placing it on technological parity with Alstom and Siemens Mobility.
2. Financial Comparison
| Financial Metric | Hitachi, Ltd. (FY2025) | Siemens AG (FY2025) | Siemens Energy (FY2025) | Schneider Electric (FY2025) |
| Total Revenue | ¥10,586.7B (~$70.5B) | €75.9B (~$82.5B) | €34.5B (~$37.5B) | €38.2B (~$41.5B) |
| Operating / EBITA Margin | 12.4% (Adj. EBITA) | 15.1% (Industrial EBITA) | 4.2% (Turnaround phase) | 18.2% (Adj. EBITA) |
| Net Income | ¥802.3B (~$5.3B) | €9.0B (~$9.8B) | €1.3B (~$1.4B) | €4.3B (~$4.7B) |
| Balance Sheet Profile | Net D/E: 0.20x; Stockholders’ equity ratio: ~44% | Industrial Net Debt / EBITDA: ~1.0x | Net cash positive (~€3.5B) | Net Debt / EBITDA: ~1.2x |
| Order Backlog | ~$47.6B (Energy division alone) | €115B (Group-wide) | €123B (Group-wide) | Project backlog high |
Financial Takeaways:
- Margin Trajectory: Hitachi’s adjusted EBITA margin of 12.4% reflects substantial restructuring, shedding low-margin non-core units(Hitachi Metals, Hitachi Chemical, Hitachi Construction Machinery). While its margins trail Schneider Electric’s asset-light, high-margin software and low-voltage business(18.2%), Hitachi generates higher margins than utility-scale peers like Siemens Energy.
- Capital Efficiency:Hitachi generated ¥1,170.2 billion in core free cash flow in FY2025 with a cash conversion rate of 103% and an ROIC of 12.4%, providing balance sheet strength to fund organic capacity expansion across transformer fabrication facilities and shareholder distributions.
Sources
- https://www.hitachi.com/en/ir/financial/
- https://www.hitachi.com/en/ir/investor/
- https://www.hitachi.com/content/dam/hitachi/global/en/press/articles/2025/04/0428/2024_An.pdf
- https://toyokeizai.net/articles/-/937543?display=b
- https://www.investing.com/news/company-news/hitachi-fy2025-slides-record-profit-on-energy-surge-digital-gains-93CH-4638039
- https://www.fortunebusinessinsights.com/industry-reports/hvdc-converter-station-market-101368
- https://www.marketsandmarkets.com/ResearchInsight/asia-pacific-hvdc-transmission-companies.asp
Back to Hitachi