Here is the summary of Equinor’s latest quarterly earnings report (Q2 2026):
1. Financial Performance
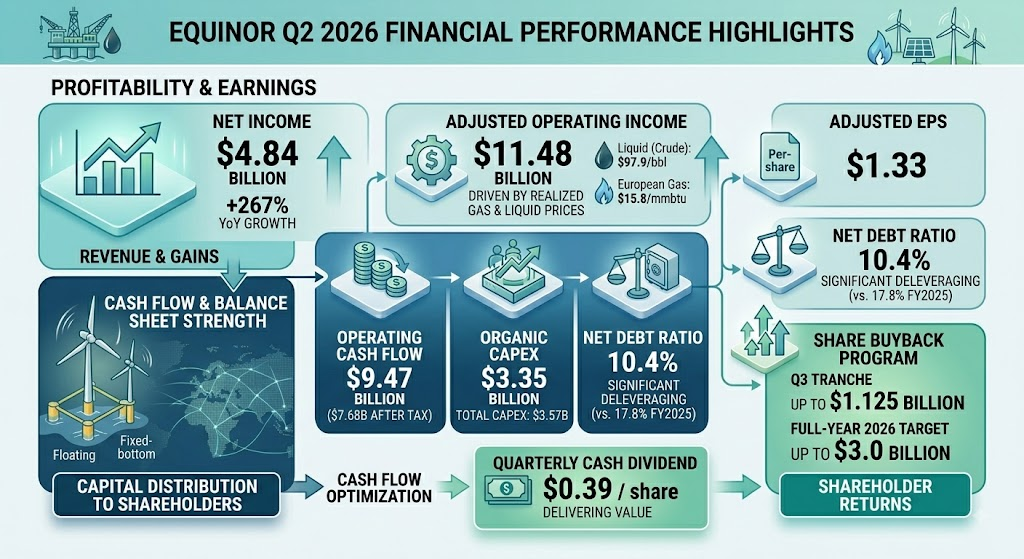
- Net Operating Income: USD 12.99 billion (up significantly from USD 5.72 billion in Q2 2025).
- Adjusted Operating Income: USD 11.48 billion (compared to USD 6.54 billion in Q2 2025).
- Net Income: USD 4.84 billion (up from USD 1.32 billion in Q2 2025).
- Adjusted EPS: USD 1.33.
- Primary Drivers: Earnings were boosted by higher global liquid prices and recovering European piped gas prices, alongside strong margins from the Marketing, Midstream & Processing (MMP) trading arm.
2. Operational Highlights
- Total Oil & Gas Production: Total equity production reached 2.165 million barrels of oil equivalent per day (mboe/day), representing a 3% YoY increase.
- Realized Prices: Realized European gas prices averaged USD 15.8 per mmbtu, while realized liquid prices reached USD 97.9 per barrel.
- Renewable Power Output: Reached 0.91 TWh, up 11% YoY, driven by capacity ramp-ups at the Dogger Bank B offshore wind farm in the UK and Serra da Babilônia solar assets in Brazil.
3. Cash Flow & Balance Sheet
- Operating Cash Flow (OCF): Cash flow from operations reached USD 9.47 billion; after tax payments, net operating cash flow stood at USD 7.68 billion.
- Capital Expenditures (Capex): Organic Capex was USD 3.35 billion, with total Capex amounting to USD 3.57 billion.
- Net Debt Ratio: Dropped to 10.4% (down from 15.3% in Q1 2026 and 17.8% at year-end 2025), reflecting a highly conservative balance sheet.
4. Shareholder Capital Distribution
- Cash Dividend: Declared a Q2 cash dividend of USD 0.39 per share.
- Share Buybacks: Initiated a 3rd tranche share buyback of up to USD 1.125 billion, maintaining its full-year 2026 share buyback target of up to USD 3.0 billion.
Here is the key summary of Equinor’s latest quarterly performance (Q2 2026), key developments, next quarter focus, and future outlook:
1. Key Highlights of the Quarter
- Surging Profitability & Strong Cash Flow: Driven by recovering liquid prices and solid European gas prices, alongside exceptional margins from the physical trading arm (MMP), Q2 net income reached USD 4.84 billion (up over 260% YoY). Operating cash flow after tax stood at USD 7.68 billion.
- Balance Sheet Strengthening: The net debt ratio dropped to 10.4% (down from 17.8% at year-end 2025), preserving a highly defensive capital structure and resilience against market volatility.
- Reaffirmed Capital Distribution: Declared a Q2 cash dividend of USD 0.39 per share and launched the 3rd tranche share buyback of USD 1.125 billion, keeping the total expected 2026 share buyback on track at up to USD 3.0 billion.
- Upstream & Renewable Execution: Brought the Eirin and Symra fields on stream on the Norwegian Continental Shelf (NCS), driving a 3% YoY total production growth (2,165 mboe/day). Power ramp-ups at Dogger Bank B offshore wind farm in the UK and solar assets in Brazil expanded renewable output by 11% YoY.
2. Key Focus for Next Quarter (Q3 2026)
- Norwegian Tax Payment Schedule: Q3 typically aligns with major Norwegian marginal petroleum tax payments, which will temporarily impact quarterly free cash flow (FCF) and net cash reserves.
- Summer Maintenance (Turnarounds): Seasonal maintenance activity across North Sea platforms usually peaks in Q3, leading to an expected temporary impact on daily oil and gas output (~35 mboe/day on an annual basis).
- European Gas Storage & Price Spikes: As European gas refilling ramps up ahead of winter, European natural gas (TTF) price volatility will directly influence MMP segment trading margins.
- Tranche 4 Share Buyback Launch: Tracking the formal approval and launch of the final 2026 share buyback tranche alongside the Q3 earnings release.
3. Future Outlook & Long-Term Guidance
- 2026 Full-Year Targets Reaffirmed:
- Production Growth: Maintains full-year oil and gas production growth guidance at 3%.
- Organic Capital Expenditures: Reaffirms organic Capex at approximately USD 13 billion.
- 2027+ Capital Distribution Framework:
- Share Buyback Range: Under price assumptions of Brent crude at $60–$80/bbl and European gas at $7–$11/mmbtu, annual share buybacks are expected to be maintained between USD 2.0 billion and USD 4.0 billion from 2027 onwards.
- Dual-Track Energy Transition:
- Progressing commercial CCS infrastructure, including the Northern Lights cross-border CO2 transport and storage initiative.
- Leveraging platform electrification (Shore-to-Power) and efficiency gains to stay on target for a 50% reduction in operational carbon emissions by 2030 and net-zero emissions by 2050.
Over the past three months (mid-May 2026 to mid-August 2026), Equinor’s stock (NYSE: EQNR) followed a sharp V-shaped trajectory. The share price initially pulled back sharply from around $39.66 to a low of $31.03 in late June, before staging a strong rally back to $40.50–$41.10 in mid-August.
Stock Price Trend Overview
- Mid-May to Late June (Correction Phase): Stock dropped from ~$39.66 down to its trough of $31.03 on June 26, representing a correction of over 20%.
- Early July (Base-Building Phase): Consolidated around the $31–$33 range before recovering.
- Late July to Mid-August (Rebound & Rally): Surged following strong Q2 earnings and capital return announcements, reaching $40.50–$41.10.
Primary Drivers Behind the Stock Movement
1. Drivers Behind the May–June Correction
- Macro Environment & Commodity Price Pullback: Easing immediate supply concerns in early June weighed down Brent crude and European natural gas spot prices.
- Capital Efficiency Concerns: Investors briefly adopted a cautious stance toward European energy majors over capital allocation and returns on renewable energy projects.
2. Drivers Behind the July–August Rally
- Commodity Spike & Geopolitical Risk Premium: Renewed geopolitical tensions in the Middle East and concerns over supply disruptions pushed Brent crude above $80–$84/bbl, while European gas prices surged. As Europe’s largest natural gas supplier, Equinor benefited directly.
- Blockbuster Q2 2026 Earnings: Equinor reported a net income of $4.84 billion (+260%+ YoY) in late July, significantly beating expectations due to strong realized oil/gas prices and solid marketing (MMP) trading margins.
- Enhanced Capital Returns: Reaffirmed a $3.0 billion share buyback target for full-year 2026, launched a $1.125 billion 3rd tranche buyback, and declared a Q2 cash dividend of $0.39 per share.
Source: