
Latest Financial Results Summary (H1 / Q2 2026)
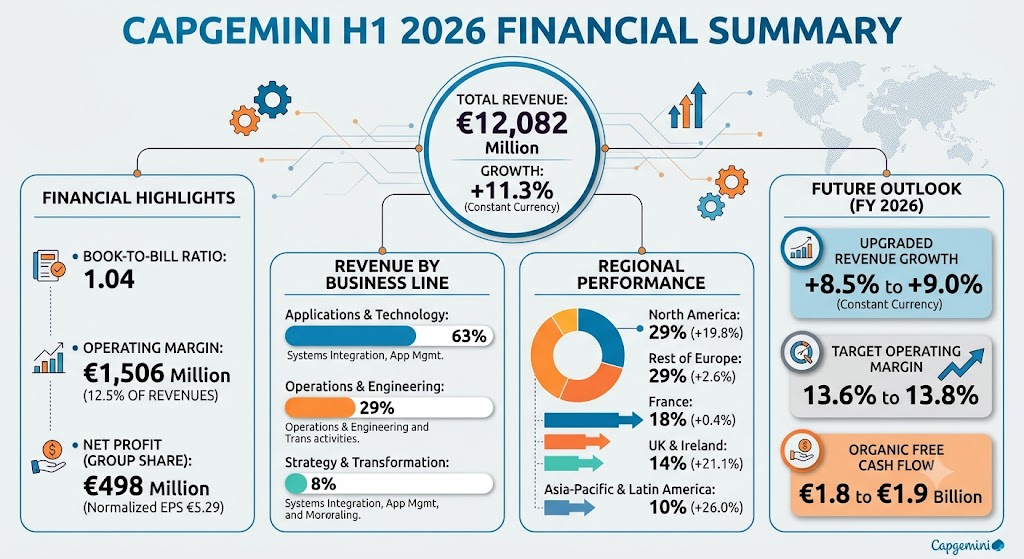
Capgemini reported revenues of €12,082 million for H1 2026, representing an 8.8% increase year-on-year at current exchange rates and 11.3% growth at constant exchange rates.For Q2 2026, revenue growth accelerated to +11.6% at constant exchange rates (+10.5% reported).Total bookings reached €12,602 million in H1 (book-to-bill ratio of 1.04) and €6,547 million in Q2 (book-to-bill ratio of 1.07).
Operating margin rose 9.3% to €1,506 million, expanding by 10 basis points to 12.5% of revenues.However, operating profit decreased by 10.1% to €878 million (7.3% of revenues) due to front-loaded restructuring costs from the company’s “Fit-for-Growth” efficiency initiative.Net profit (Group share) dropped 31.3% to €498 million, yielding a normalized EPS of €5.29 (-11.9% YoY).Organic free cash flow stood at €37 million.
Revenue Mix by Business Line and Region
Business Line Breakdown (% of 2025 Group Revenues)
- Applications & Technology (63%): Covers application management services, system integration, and software technology. Revenue grew +5.0% year-on-year at constant exchange rates.
- Operations & Engineering (29%):Includes cloud/infrastructure operations, business process services (Intelligent Business Operations), and engineering/R&D services via Capgemini Engineering.Revenue surged +24.7% year-on-year at constant exchange rates, boosted by acquisitions (WNS, Cloud4C).
- Strategy & Transformation (8%):Driven by Capgemini Invent, offering executive advisory, digital design (frog), and innovation strategy.Revenue increased +9.2% year-on-year at constant exchange rates.
Regional Performance & Growth Drivers (H1 2026 Revenue % Share & Growth)
- North America (29% of revenue):Generated €3,501 million (+19.8% YoY at constant exchange rates).Growth was propelled by high demand in Financial Services and Manufacturing, along with strong AI implementation projects.
- Rest of Europe (29% of revenue):Generated €3,506 million (+2.6% YoY at constant exchange rates).Growth remained modest amid economic headwinds in continental Europe.
- France (18% of revenue):Generated €2,142 million (+0.4% YoY at constant exchange rates). Local market conditions remained sluggish, causing utilization pressure.
- United Kingdom & Ireland (14% of revenue):Generated €1,746 million (+21.1% YoY at constant exchange rates).Driven by public sector demand, defense, technology sovereignty initiatives, and enterprise AI transformation.
- Asia-Pacific & Latin America (10% of revenue):Generated €1,187 million (+26.0% YoY at constant exchange rates). Outpacing other regions due to offshore delivery expansion and regional cloud migration demand.
Quarter-over-Quarter Changes, Key Watchpoints, and Future Outlook
Quarterly Changes & Key Shifts
- Growth Acceleration:Q2 2026 constant-currency revenue growth accelerated to 11.6% compared to 11.0% in Q1 2026.
- Restructuring & Restraint: Restructuring expenses were heavily front-loaded into H1 2026 under the “Fit-for-Growth” program. Margin expansion in North America (+20 bps to 16.5%) helped offset margin softness in France (down to 7.7%).
Next Quarter & Near-Term Watchpoints
- Fit-for-Growth Execution:Realization of structural cost savings in continental Europe expected to kick in starting in H2 2026.
- AI Monitization & Deal Conversion:Monitored conversion rate of the €13.3 billion opportunity pipeline in generative AI and Intelligent Business Operations into billable revenue.
- Utilization Recovery:Margin improvement in France and Rest of Europe following capacity realignments.
Future Outlook & Guidance
- Upgraded FY 2026 Revenue Growth:Raised target to +8.5% to +9.0% at constant exchange rates (previously +6.5% to +8.5%), with inorganic contributions contributing ~5.0 points.
- FY 2026 Operating Margin:Confirmed target range of 13.6% to 13.8% (up 30-50 bps YoY).
- FY 2026 Free Cash Flow:Maintained organic free cash flow target of €1.8 billion to €1.9 billion.
- 2028 Long-Term Ambition:Targeting a 3-year revenue CAGR of 5.5% to 7.5% and cumulative organic free cash flow above €6 billion over 2026–2028.
Stock Price Movement Over the Last Three Months
Over the past three months (June 2026 to August 2026), Capgemini SE (EPA: CAP) experienced notable volatility, trading between a low of €85.62 and recovering toward €109.45 by late August:
- June 2026 Drop: In early June, shares stood around €109.10 but faced continuous selling pressure throughout the month, dropping below €90.00 by mid-June. This decline was driven by broader weakness across European IT and software stocks following Accenture’s lowered guidance, which raised market fears regarding enterprise IT spending cutbacks.
- July 2026 Lows & Rebound: The stock hit its period low of €85.62 in late July. However, following the release of H1 2026 results on July 30, 2026, the stock staged a sharp rally from ~€86.06 up to €107.10 within days. Investors responded positively to the upgrade in full-year revenue guidance (+8.5% to +9.0%), accelerating Q2 revenue growth, and strong book-to-bill momentum.
- August 2026 Stabilization: During August 2026, the stock stabilized in the range of €105.00 to €111.00, reflecting renewed investor confidence in Capgemini’s AI strategy and cost optimization trajectory.
Sources
- https://investors.capgemini.com/en/publication/2026-h1-results/
- https://investors.capgemini.com/en/event/h1-2026-results/
- https://investors.capgemini.com/en/file/30833?download=1
- https://quartr.com/events/capgemini-se-cap-q2-2026_3swPqTf9
- https://www.morningstar.com/stocks/xpar/cap/quote
Back to Capgemini