Based on the Bank of America 4Q25 earnings release, here are the key changes and performance highlights for the quarter:
1. Earnings Growth and Margin Expansion
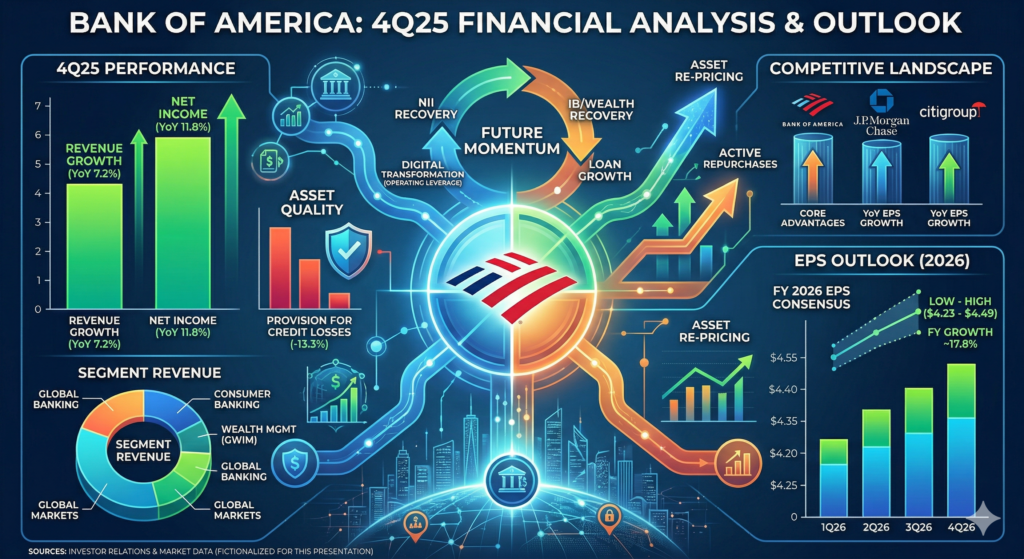
Net income reached 7600M, an 11.8% increase compared to 6800M in the same period last year. This was primarily driven by strong growth in Net Interest Income (NII), which reached 15800M this quarter, representing a 9.7% YoY increase. Despite market fluctuations, the net interest margin benefited from a higher interest rate environment and loan balance growth, exceeding expectations.
2. Improved Asset Quality
The provision for credit losses for this quarter was 1300M, a 13.3% decrease from 1500M in the prior year. This suggests that the bank’s asset quality remains robust under current economic conditions, with customer default risks trending lower than last year, which helped bolster the bottom line.
3. Segment Performance
Consumer Banking remains the primary revenue pillar, contributing 10.5B. Notably, Global Markets delivered a strong performance with revenue of 5.1B, demonstrating the resilience of its trading and investment banking operations during periods of market volatility.
4. Growth in Both Deposits and Loans
Total deposits increased to 2010B (up 3.1% YoY), while total loans and leases saw a significant 8.3% growth to 1170B. This reflects continued strong loan demand from customers and the bank’s ability to maintain competitiveness in attracting deposits.
5. Increased Capital Returns
Total capital returned to shareholders reached 8200M this quarter, up 15.5% YoY. This includes a significant increase in share repurchases to 6300M (up 18.9% YoY) and higher dividend payments, highlighting the company’s commitment to returning value to shareholders following improved profitability.
6. Operational Efficiency Optimization
While non-interest expense rose slightly by 2.2% to 18500M, revenue growth (7.2%) significantly outpaced the increase in expenses. This demonstrates positive operating leverage, driving the pre-tax profit margin up to 30.3%.
Based on the earnings report and management outlook, Bank of America’s growth momentum for the coming quarter and beyond is primarily focused on the following areas:
1. Continued Recovery in Net Interest Income (NII)
Management expects Net Interest Income to return to a growth trajectory in 2026 after hitting a trough in late 2025. With the continuous expansion of loan balances (especially in commercial and credit card loans) and the re-pricing of securities portfolios in a higher interest rate environment, interest margins are expected to expand further.
2. Operating Leverage from Digital Transformation
Bank of America continues to invest in digital financial technology, with digital active users and transaction volumes reaching new highs. This not only enhances customer loyalty but, more importantly, reduces the marginal costs of branch operations. Non-interest expenses are expected to remain stable in the next quarter, allowing revenue growth to consistently outpace expense growth through operating leverage.
3. Recovery in Wealth Management and Investment Banking
- Wealth Management (GWIM): As market sentiment warms up, asset management fee income is growing due to the increase in Assets Under Management (AUM).
- Investment Banking: Mergers and Acquisitions (M&A) and underwriting activities for equity and debt are expected to recover further, driving growth in fee income.
4. Stable Control of Credit Costs
Despite macroeconomic uncertainties, the decline in provisions this quarter indicates that asset quality is better than expected. If unemployment remains low and consumer spending stays stable, lower credit costs will continue to unlock profit margins.
5. Flexibility in Capital Allocation
A strong capital adequacy ratio (CET1 Ratio) enables the bank to continue large-scale share repurchases in the next quarter (having already reached 6300M this quarter). This will reduce the number of outstanding shares and directly boost Earnings Per Share (EPS) in future quarters.
Growth Momentum Summary Table
| Source of Momentum | Key Drivers | Expected Impact |
| Interest Income | Loan growth, asset re-pricing | Revenue growth |
| Fee Income | IB activity recovery, AUM growth | Higher non-interest income |
| Cost Control | Digital platform adoption, automation | Margin improvement |
| Capital Policy | Aggressive share repurchases | Increased shareholder return (EPS) |
Based on the latest market analysis and analyst projections, Bank of America (BAC) is expected to show a trend of steady growth in its Earnings Per Share (EPS) throughout 2026.
Below is the EPS trend forecast and estimated range for the 2026 fiscal year:
EPS Forecast and Range
| Time Period | Consensus Estimate | Estimated Range (Low – High) | Est. YoY Growth |
| Full Year 2026 | $4.35 – $4.36 | $4.23 – $4.49 | ~17.8% |
Quarterly Estimates (2026)
- 1Q26: $0.96 – $1.01 (Expected release on April 15, 2026)
- 2Q26: $1.02 – $1.14
- 3Q26: $1.11 – $1.17
- 4Q26: $1.17 – $1.20
Key Factors Driving Upward EPS Momentum
- Recovery in Net Interest Income (NII): Analysts expect NII to rebound in 2026 following a trough in late 2025, driven by loan growth (projected at 5-7%) and asset re-pricing.
- Strong Capital Returns: The bank’s continued large-scale share repurchases (e.g., 6300M in 4Q25) will effectively reduce the number of outstanding shares, directly boosting EPS.
- Operating Leverage: Digital transformation is helping keep expenses relatively stable. Revenue growth is expected to outpace expense growth, further expanding profit margins.
- Investment Banking and Wealth Management Fees: Improved market conditions, new client growth in Merrill Lynch and Private Banking, and a recovery in M&A and underwriting activities are expected to contribute more non-interest income.
Potential Risks
If the U.S. economy slows down more than expected over the next year, or if aggressive Fed rate cuts compress margins faster than asset portfolios can adjust, EPS may fall toward the lower end of the range (around $4.23). Conversely, a resilient economy and active capital markets could push EPS toward $4.49 or higher.
In the fourth quarter of 2025 (4Q25) and heading into 2026, the competitive landscape between Bank of America and its primary rivals (such as JPMorgan Chase, Citigroup, and Wells Fargo) has revealed several key shifts:
1. Competition in Operational Efficiency and Digitalization
Bank of America and its largest competitor, JPMorgan Chase, are engaged in a race for “operating leverage.”
- Bank of America: Focused on optimizing its efficiency ratio, which improved to 61% this quarter. The goal is to control expenses through digitalization (69% of consumer sales are now digital), ensuring revenue growth outpaces expense growth.
- JPMorgan Chase: Emphasizing a “scale strategy,” announcing a massive 50B share repurchase plan and expanding its footprint in the payments and credit card market through partnerships like Apple Card.
2. Market Share Battles in Wealth Management and Investment Banking
As market sentiment improves, competition for non-interest income has intensified:
- Wealth Management: Bank of America’s Merrill Lynch remains steady but faces a strong challenge from JPMorgan, whose wealth management Assets Under Management (AUM) reached 4.80T.
- Investment Banking: The market is seeing a resurgence in M&A and IPO activity. While JPMorgan maintains a firm lead in capital markets, Citigroup has become a “turnover dark horse,” significantly boosting its EPS (up 17.9% YoY) following a major organizational restructuring.
3. Defensive and Offensive Strategies in Interest Income (NII)
- Strategic Differences: Bank of America’s core strength lies in its massive domestic deposit base, providing a lower cost-of-funds advantage during rate volatility. In contrast, Citigroup’s business is more international and more susceptible to global economic fluctuations.
- Growth Expectations: Bank of America provided 2026 NII growth guidance of 5-7%, which is considered aggressive among large banks, reflecting confidence in its deposit stickiness and loan growth.
4. Key Financial Metrics Comparison (4Q25)
| Metric | Bank of America (BAC) | JPMorgan Chase (JPM) | Citigroup (C) |
| Revenue Growth (YoY) | 7.2% | 7.0% | 7.0% |
| EPS Growth (YoY) | 19% | -4% (Impacted by items) | 17.9% |
| Net Profit Margin | 28.4% | 33.9% | Improving |
| Core Advantage | Consumer Banking, Digital | Scale, IB Leadership | Cost Savings, Restructuring |
5. Application of AI and New Technologies
Competition in 2026 has moved beyond interest rates to AI governance and application.
- Bank of America is utilizing GenAI to enhance automated workflows and customer service efficiency.
- Competitors like JPMorgan have begun deploying AI trading bots and utilizing more complex risk management frameworks to attract high-net-worth clients and institutional traders.
Summary
Bank of America demonstrated “steady progress” in its competitiveness this quarter, particularly in consumer deposits and digital transformation efficiency. While it still trails JPMorgan in absolute profit scale and investment banking market share, its relatively lower P/E ratio (approx. 11x vs. JPM’s 14x) and clear growth guidance make it a stock with significant potential upside in the eyes of many analysts.
Source:
- Seeking Alpha – BAC Earnings Estimates
- MarketBeat – Bank of America Earnings Forecast
- Zacks Investment Research
- J.P. Morgan Asset Management 4Q25 Update
- Tickeron – Citigroup vs. Bank of America vs. JPMorgan Analysis
- 24/7 Wall St – JPM vs BAC Comparison
Back to Bank of America page