
Financial Results Summary (H1 2026)
AIB Group plc reported results for the half-year ended June 30, 2026 (European banks primarily report comprehensive figures semi-annually):
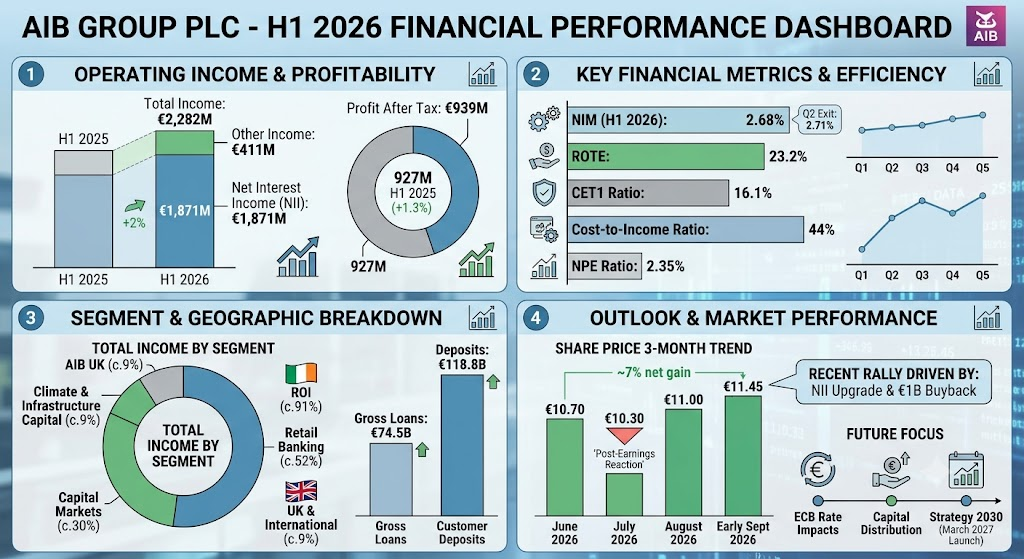
- Total Operating Income:€2,282 million, up 2% year-over-year.
- Net Interest Income (NII):€1,871 million, remaining stable despite interest rate shifts.
- Other Income:€411 million, up 15% year-over-year, driven by fee growth, wealth, and insurance activities.
- Profit After Tax:€939 million, up from €927 million in H1 2025.
- Earnings Per Share (EPS):42.2 cents, an 8% increase year-over-year.
- Net Interest Margin (NIM):2.68% for H1, with an exit rate rising to 2.71% in Q2 2026.
- Efficiency & Returns:Cost-to-income ratio (CIR) remained disciplined at 44%, with operating expenses rising 2% to €1,001 million.Return on Tangible Equity (ROTE) reached 23.2%.
- Capital & Balance Sheet:CET1 capital ratio stood at 16.1%.Gross loans rose 3% year-to-date to €74.5 billion (new lending up 10% to €7.5 billion), and customer deposits rose 1.3% to €118.8 billion.
- Shareholder Returns:Declared an interim dividend of 19.528 cents per share (€406 million, up ~60% year-over-year) alongside an ongoing €1 billion share buyback program (€410 million executed through June).
Segment Breakdown and Geographic Presence
AIB Group reports across four operating business divisions plus Group/Treasury central operations:
| Segment | Share of Total Income (approx.) | Core Business Activities |
| Retail Banking | ~50% – 53% | Personal banking, consumer lending, digital mortgages, micro-SME accounts, payments, and wealth products in Ireland. AIB commands a 30% mortgage market share and a 46% direct mortgage channel share. |
| AIB Capital Markets | ~28% – 31% | Corporate banking, commercial real estate finance, syndicated lending, treasury operations, and risk management solutions for corporate/institutional clients. |
| Climate & Infrastructure Capital | ~8% – 10% | Dedicated renewable energy financing, sustainable infrastructure projects, and transition financing across Europe and North America (e.g., California storage and European renewables). |
| AIB UK | ~8% – 10% | Commercial and retail banking operations serving niche corporate sectors in Great Britain and retail banking in Northern Ireland under the Allied Irish Bank (GB) and AIB NI brands. |
- Geographic Distribution:
- Republic of Ireland (~90% – 92% of operations): The core domestic market. Customer deposits stand at 93% ROI-based, benefiting from market consolidation and strong structural population/employment demand.
- United Kingdom & International (~8% – 10% of operations): Concentrated primarily in Northern Ireland and specialized sector lending in Great Britain, alongside selected international green energy and infrastructure participations in the US and Europe.
Period Observations and Future Outlook
- Recent Key Developments:
- NIM Trough Passing:Margin contraction moderated faster than consensus anticipated, exiting Q2 at 2.71% due to asset yield resilience and a steady 20% deposit beta.
- Asset Quality:Expected credit loss (ECL) charge was €91 million (cost of risk of 25 bps).Non-performing exposures (NPE) ticked up slightly to 2.35% (from 2.20% at year-end 2025), but overall ECL coverage remained intact at 1.6%.
- Digital Automation:Replaced legacy interactions via the “Abi” AI assistant (handling ~6,500 daily calls) and completed 29% of mortgages and 90% of personal loans digitally.
- Next Quarter / Full-Year Observation Points:
- ECB Rate Trajectory:Tracking the net interest income trajectory as deposit rate benchmarks decline toward management’s modeled 2.50% year-end assumption.
- Capital Distribution Execution: Completion of the remaining ~€590 million of the €1 billion buyback and capacity to distribute beyond the 40%-60% ordinary payout target.
- Preparation of “Strategy 2030”:Investor focus on management targets scheduled for disclosure alongside FY 2026 results in March 2027.
- Forward Guidance (FY 2026):
- NII:Raised to > €3.8 billion (previously circa €3.8 billion).
- Other Income:Expected at ~€800 million (upgraded from > €750 million).
- Balance Sheet Growth:Gross loan expansion of ~5% and deposit expansion of > 3%.
- Credit & Costs: Cost of risk between 20-30 bps; operating cost growth capped at ~2%; ROTE projected above 20%.
Three-Month Share Price Performance and Drivers
- Price Trend (June 2026 – Early September 2026):
- Shares traded near €10.50 – €10.80 in early June 2026, dipped post-earnings in late July down toward €10.20 – €10.40, and subsequently rallied through August and early September to €11.40 – €11.50, achieving a 3-month net gain of approximately 6% to 8%.
- Market Drivers:
- Earnings Sell-Off Reaction: On earnings release day (July 30), shares dropped 3.7% to 4.2%. Although profit beat forecasts, markets penalized the conservative tone, lack of an aggressive full-year upgrade, and an NPE ratio increase to 2.35%.
- Subsequent Re-Rating & Buyback Support: Throughout August 2026, consistent underlying liquidity from the active €1 billion share repurchase program and resilient domestic macroeconomic data in Ireland stabilized demand.
- Supportive Analyst Catalysts:Major institutional updates (including Citi reiterating a Buy with a €12.10 target and Morgan Stanley lifting price targets to €12.00) highlighted AIB’s above-20% ROTE and potential for excess capital distribution.
Information Sources
- https://www.investing.com/news/company-news/aib-group-h1-2026-slides-strong-profit-digital-gains-amid-market-caution-93CH-4822896
- https://www.investing.com/news/transcripts/earnings-call-transcript-aib-group-posts-strong-h1-2026-profit-as-shares-fall-93CH-4822816
- https://www.investegate.co.uk/announcement/rns/aib-group-cdi—aibg/half-year-financial-report-2026/9694690
- https://quartr.com/events/aib-group-a5g-h1-2026_F9tz3lDD
- https://www.tradingview.com/news/marketbeat:d280505a7094b:0-aib-group-h1-earnings-call-highlights/
- https://www.investing.com/equities/allied-irish-b-historical-data
Back to AIB