
Latest Earnings Summary: H1 2026
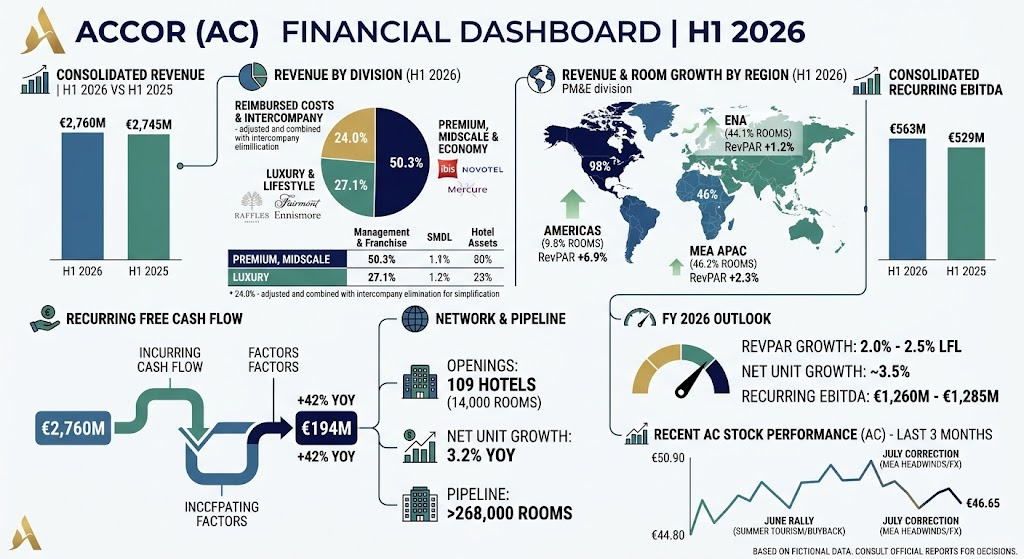
Accor reported consolidated revenue of €2,760 million for the first half of 2026, representing an increase of 3.0% at constant currency (0.6% on a reported basis) compared to H1 2025. Consolidated Recurring EBITDA reached €563 million, rising 6.5% year-over-year at constant currency.RevPAR (Revenue Per Available Room) grew 2.2% like-for-like, or 4.6% excluding the Middle East.Reported net profit attributable to the Group stood at €114 million, down from €233 million in H1 2025 due to non-recurring expenses, while adjusted net profit remained resilient at €231 million. Recurring Free Cash Flow surged 42% to €194 million. Network expansion continued with 109 hotel openings (around 14,000 rooms), translating to a 3.2% net unit growth year-over-year and expanding the pipeline by 11.4% to over 268,000 rooms.
Revenue Breakdown by Division and Geography
Accor reports revenue across two core operating divisions alongside reimbursed costs and internal transactions:
- Premium, Midscale & Economy (PM&E):Accounts for approximately 50.3% of total revenue (€1,389 million, up 2.2% at constant currency). This division oversees brands such as ibis, Novotel, Mercure, and Pullman. Revenue is driven by Management & Franchise fees (€424 million), Sales, Marketing, Distribution & Loyalty (SMDL, €460 million), and Hotel Assets & Other (€505 million).
- Luxury & Lifestyle (L&L):Accounts for approximately 27.1% of total revenue (€749 million, down 1.9% at constant currency). It encompasses luxury names (Raffles, Fairmont, Sofitel) and lifestyle concepts under Ennismore. Revenue streams include Management & Franchise fees (€261 million, up 12.0% at constant currency), SMDL (€200 million), and Hotel Assets & Other (€289 million).
- Reimbursed Costs & Intercompany:Reimbursed costs represent 24.0% of total revenue (€663 million, up 10.4% at constant currency), offsetting expenditures incurred on behalf of hotel owners. Intercompany eliminations accounted for €(41) million.
Geographic Development and Regional Performance:
- Europe & North Africa (ENA): Accounts for 44.1% of PM&E rooms (329,171 rooms). RevPAR increased by 1.2% in H1 2026, supported by steady domestic travel and business demand across France, the UK, and Germany, alongside normalized post-Olympic comparisons.
- Middle East, Africa & Asia-Pacific (MEA APAC): Accounts for 46.2% of PM&E rooms (345,137 rooms). RevPAR increased by 2.3% in H1 2026. While Southeast Asia and India delivered double-digit fee and room additions, geopolitical tensions in parts of the Middle East created an occupancy drag that slowed overall region-wide expansion.
- Americas: Accounts for 9.8% of PM&E rooms (73,420 rooms). RevPAR grew 6.9% like-for-like, driven by strong average daily rate (ADR) increases in Brazil and Latin America, as well as business group travel recovery across North America.
Quarterly Drivers, Future Outlook, and Key Watchpoints
During H1 2026, growth was driven by disciplined pricing strategies, solid corporate leisure demand, and high-quality net room additions. However, the Luxury & Lifestyle segment experienced an occupancy softness (-0.7 percentage points) primarily tied to Middle East disruptions and asset portfolio reshuffling following the disposal of Paris Society’s festive operations.
Future Outlook and Guidance for Full-Year 2026:
- RevPAR Growth:Projected at 2.0% to 2.5% like-for-like.
- Net Unit Growth:Expected to reach around 3.5%.
- Recurring EBITDA: Guided between €1,260 million and €1,285 million (incorporating an estimated negative €10 million FX impact in H2).
Key Watchpoints for Upcoming Quarters:
- Middle East Stabilization: Monitoring RevPAR recovery in the UAE and surrounding markets, which weighed on Q2 and H1 group-level figures.
- Pipeline Conversion in India & Greater China: Tracking conversion velocity and opening timetables for the 268,000-room pipeline.
- Capital Allocation: Execution of the second €225 million tranche of the €450 million share buyback program and final decisions regarding the potential IPO/listing of Ennismore.
3-Month Stock Price Performance and Market Drivers
Over the past three months (June to September 2026), Accor SA (EPA: AC) traded in a band between €44.80 and €50.90, closing around €46.65 to €46.90 in early September 2026 (a modest net gain of ~3.5%).
Key market factors influencing price movement:
- June Rally: The stock advanced from €45.10 to a peak above €50.80 late in June 2026, buoyed by positive summer European tourism booking indications and enthusiasm surrounding share repurchases.
- July Correction: Shares pulled back into the €45–€47 range heading into late July, as investors digested Middle Eastern operational headwinds, broader macroeconomic caution in European discretionary spending, and FX pressure from the Turkish lira and US dollar.
- August-September Stabilization:Following the H1 2026 earnings release, the confirmation of the €1.26–€1.285 billion EBITDA target and the activation of the second €225 million buyback tranche provided a floor, stabilizing the share price around €46.50–€47.00.
Information Sources
- https://group.accor.com/en/news-stories/accor-half-year-2026-results
- https://group.accor.com/en/finance/financial-results
- https://press.accor.com/half-year-2026-resultsaccor-shows-its-agility-in-a-challenging-global-environment/?lang=eng
- https://quartr.com/companies/accor-sa_13415
- https://www.investing.com/equities/accor-historical-data
Back to Accor