
Below is the earnings summary for Anheuser-Busch InBev (AB InBev) for Q2 2026 and HY26:
1. Core Financial Performance
- Revenue: Second-quarter 2026 revenue reached $16.66 billion, up 5.6% organically (reported growth of 11.0%). Revenue per hectoliter (hl) grew 4.2%.
- Volume: Total volumes grew 0.9% organically in Q2 2026, with beer volumes up 1.1%. Mexico, Colombia, and Ecuador delivered record-high second-quarter volume levels.
- EBITDA & Profitability: Organic Normalized EBITDA grew 5.8% to $5.94 billion in Q2 2026, with a Normalized EBITDA margin of 35.6%. Underlying EPS rose 23.4% to $1.21.
- Free Cash Flow & Net Debt: Free cash flow for HY26 reached $3.88 billion, an increase of $2.53 billion year-over-year. Net debt-to-normalized EBITDA ratio improved to 2.86x.
2. Brand & Portfolio Highlights
- Global Megabrands: Combined revenue for global megabrands increased by 6.2% in Q2 2026. Corona grew 17% outside of its home market.
- No-Alcohol & Beyond Beer: No-alcohol beer revenues jumped 27% in Q2 2026. Beyond Beer revenue grew 44%, led by Cutwater and Flying Fish.
3. Digital Ecosystem (BEES)
- Digital Reach: As of June 2026, BEES was active across 30 markets, capturing 72% of AB InBev’s total revenues.
- Gross Merchandise Value (GMV): BEES processed $15 billion in total GMV during Q2 2026, up 16% year-over-year. Third-party product sales via BEES Marketplace surged 50% to $1.2 billion.
4. Full-Year Guidance
- 2026 Outlook Reaffirmed: Reaffirmed full-year 2026 guidance, expecting organic EBITDA growth between 4% and 8%.
Sources
- https://www.nasdaq.com/press-release/ab-inbev-reports-second-quarter-2026-results-2026-07-30
- https://www.businesswire.com/news/home/20260729033132/en/AB-InBev-Reports-Second-Quarter-2026-Results
- https://www.tradingview.com/news/zacks:0573c80f7094b:0-ab-inbev-misses-q2-earnings-revenues-estimates-reaffirms-2026-view/
According to Anheuser-Busch InBev(AB InBev)’s official Q2 2026 and HY26 financial reports, the company reports its primary financial results by Geographic Segments (as required by official reporting standards) while providing operational performance metrics by Product Categories & Strategic Portfolios.
Revenue Breakdown by Geographic Segments
- Middle Americas: ~30%-35% of Revenue (approx. 41% of EBITDA)Covers Mexico, Colombia, Ecuador, Peru, and Central America. Serves as the company’s highest-margin region, driven by strong market share gains and record-high second-quarter volume levels in key markets.
- North America: ~25%-28% of Revenue (approx. 20% of EBITDA)Covers the United States and Canada. Focuses on premium core brands like Michelob ULTRA, while driving rapid growth in spirits-based ready-to-drink (RTD) cocktails and Beyond Beer categories.
- South America: ~20%-22% of Revenue (approx. 18% of EBITDA)Covers Brazil, Argentina, and Chile. Led by Brazil, where beer volumes returned to positive growth alongside accelerated expansion of super-premium brands.
- Europe, Middle East & Africa (EMEA): ~14%-16% of Revenue (approx. 14% of EBITDA)Covers Western Europe, Eastern Europe, South Africa, and Nigeria. Growth is powered by strong demand for Corona across Europe and premium portfolio expansion in Africa.
- Asia Pacific: ~10%-12% of Revenue (approx. 7% of EBITDA)Covers China, South Korea, India, and Vietnam (operated via Budweiser APAC). Focuses on premium and super-premium segments, with South Korea showing strength while China navigates broader consumer market adjustments.
Business Overview by Product Portfolio
- Global Megabrands: Includes Budweiser, Corona, Stella Artois, and Michelob ULTRA. Serves as the primary driver of revenue and margin expansion, with combined megabrand revenues growing 6.2% in Q2 2026.
- Core & Mainstream Beer: Includes strong regional powerhouses such as Harbin, Skol, Cass, and Aguila, providing a solid volume baseline and broad consumer reach.
- Beyond Beer: Encompasses Cutwater ready-to-drink cocktails, hard seltzers, and flavored malt beverages. Represents the fastest-growing category, delivering 44% revenue growth in Q2 2026.
- No-Alcohol Beer: Led by Corona Cero and Budweiser Zero. Captures health-conscious consumer occasions, delivering 27% revenue growth in Q2 2026.
- BEES Marketplace Third-Party Products: Generates digital revenues by opening its B2B e-commerce platform to third-party consumer packaged goods (CPG) partners, with marketplace gross merchandise value (GMV) growing 50% to $1.2 billion in Q2 2026.
Sources
- https://www.nasdaq.com/press-release/ab-inbev-reports-second-quarter-2026-results-2026-07-30
- https://www.businesswire.com/news/home/20260729033132/en/AB-InBev-Reports-Second-Quarter-2026-Results
- https://www.alpha-sense.com/earnings/bud/
- https://ca.investing.com/news/company-news/ab-inbev-q2-2026-slides-megabrands-fuel-23-eps-growth-93CH-4765278
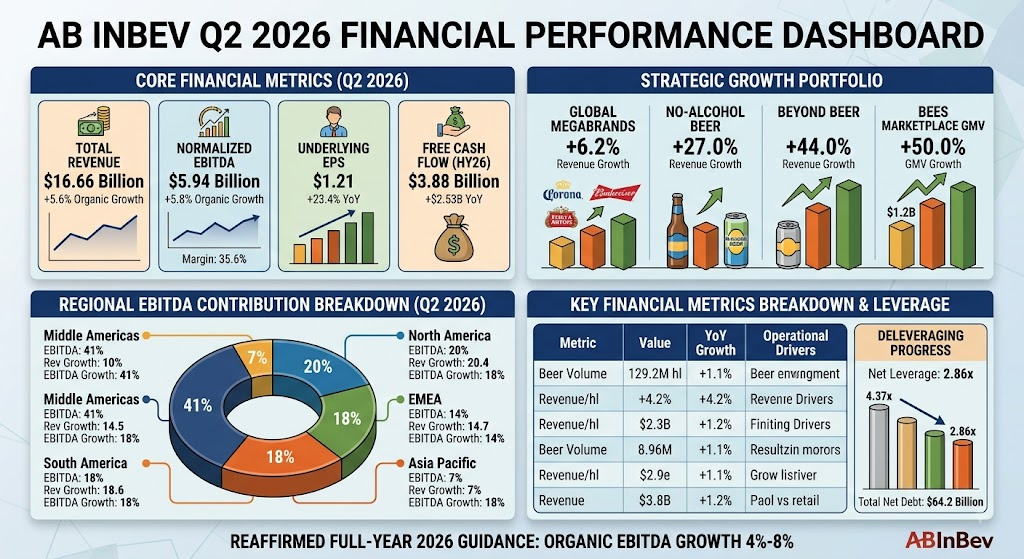
AB INBEV Q2 2026 FINANCIAL PERFORMANCE DASHBOARD
Financial Metric Breakdown
| Financial Metric | Q2 2026 Value | YoY Growth (Organic/Reported) | Operational Drivers |
| Total Revenue | $16.66 Billion | +5.6% Organic (+11.0% Reported) | Driven by +4.2% Revenue/hl growth & +0.9% total volume growth |
| Beer Volume | 129.2M Hectoliters | +1.1% Organic | All-time high Q2 volumes in Mexico, Colombia & Ecuador |
| Normalized EBITDA | $5.94 Billion | +5.8% Organic | EBITDA margin expanded 4 bps to 35.6% |
| Underlying EPS | $1.21 | +23.4% YoY | Operational leverage, interest savings & foreign exchange tailwinds |
| Free Cash Flow (HY26) | $3.88 Billion | +$2.53 Billion YoY | Driven by +$1.2B EBITDA growth & +$1.3B favorable working capital |
| Net Debt / EBITDA | 2.86x | Improved from 4.37x | Total net debt reduced to $64.2 Billion |
Back AB InBev