Tesla Q4 2025 Business Update
Financial Highlights
- Total Revenue: Reached 28.7 billion, representing a 14% year-over-year increase.
- Profitability: GAAP operating income stood at 2.4 billion with an 8.2% operating margin. GAAP net income was 2.3 billion, while non-GAAP net income reached 2.7 billion.
- Cash Position: Cash, cash equivalents, and investments increased to 36.5 billion by the end of the quarter.
Vehicle Production and Delivery
- Deliveries: Quarterly deliveries hit approximately 522,000 vehicles. Total deliveries for the full year 2025 reached approximately 1.83 million.
- Production: The Fremont and Shanghai factories maintained high utilization, while production at Gigafactory Texas and Berlin continued to scale efficiently.
Technology and AI Progress
- FSD (Supervised): Rolled out version 13 to a wider user base, showing significant improvements in complex urban driving scenarios.
- AI Infrastructure: Expanded AI training capacity, including the deployment of a large-scale H100/H200 cluster at Giga Texas.
- Next-Gen Platforms: Confirmed that more affordable vehicle models remain on track to begin production in the first half of 2025.
- Cybertruck: Production continued to ramp, achieving positive gross margin for the first time this quarter.
Energy and Storage
- Energy Storage: Deployed 7.6GWh of storage products in Q4. Total deployments for the full year 2025 reached 23.1GWh, marking significant growth in the Megapack and Powerwall sectors.
Future Outlook
Tesla anticipates a 20% to 30% growth in vehicle deliveries for 2026 compared to 2025. The strategic focus remains on reducing cost per vehicle, accelerating AI-driven products, and scaling the energy business.
Tesla Full Year 2025 Income Statement Analysis
| Item | FY 2025 | % of Total Rev | FY 2024 | YoY |
| Revenues | ||||
| Automotive sales | 81,142 | 80.6% | 78,510 | 3% |
| Regulatory credits | 2,126 | 2.1% | 1,790 | 19% |
| Automotive leasing | 1,930 | 1.9% | 2,120 | -9% |
| Total automotive revenues | 85,198 | 84.6% | 82,420 | 3% |
| Energy generation and storage | 9,141 | 9.1% | 6,035 | 51% |
| Services and other | 6,338 | 6.3% | 8,319 | -24% |
| Total revenues | 100,677 | 100.0% | 96,774 | 4% |
| Cost of revenues | 82,538 | 82.0% | 79,113 | 4% |
| Gross Profit | 18,139 | 18.0% | 17,661 | 3% |
| Operating Expenses | ||||
| Research and development | 4,923 | 4.9% | 3,969 | 24% |
| Selling, general and administrative | 5,346 | 5.3% | 4,800 | 11% |
| Restructuring and other | 497 | 0.5% | (33) | N/A |
| Total operating expenses | 10,766 | 10.7% | 8,736 | 23% |
| Income from operations | 7,373 | 7.3% | 8,925 | -17% |
| Interest & Other income, net | 1,390 | 1.4% | 1,170 | 19% |
| Income before income taxes | 8,763 | 8.7% | 10,095 | -13% |
| Net Income | 7,092 | 7.0% | 14,974 | -53% |
Annual Financial Analysis
1. Revenue Milestones and Segmentation
Tesla’s total revenue surpassed the 100 billion mark for the first time in 2025. While Automotive revenue saw modest growth of 3%, the Energy Generation and Storage segment emerged as a significant growth driver, surging 51% year-over-year. This shift highlights Tesla’s successful diversification beyond vehicle sales.
2. Profitability and Margin Compression
Gross margin remained relatively stable at 18.0%. However, Operating Margin declined from 9.2% in 2024 to 7.3% in 2025. This compression was primarily driven by a 23% increase in operating expenses, as the company prioritized long-term investments in AI, autonomous driving infrastructure, and the scale-up of new vehicle platforms.
3. Investment in Future Technology
R&D expenses grew by 24%, reflecting the intensive capital allocation toward FSD v13, the Optimus program, and the expansion of the H100/H200 GPU clusters. Despite the impact on short-term operating income, these investments are central to Tesla’s transition into an AI and robotics company.
4. Net Income Context
The 53% decline in Net Income is largely due to a high base effect from FY 2024. In the prior year, Tesla recorded a massive non-cash tax benefit of approximately 5.9 billion. On a normalized basis, the company’s core profitability remains resilient as Cybertruck production reached a positive gross margin toward the end of the year.
Tesla Balance Sheet (USD in millions)
| Item | 2025/12/31 | % of Total Assets | 2024/12/31 | YoY |
| Assets | ||||
| Cash and investments | 36,539 | 30.0% | 29,094 | 26% |
| Inventory & Receivables | 16,846 | 13.8% | 16,364 | 3% |
| Other current assets | 5,463 | 4.5% | 4,640 | 18% |
| Total current assets | 58,848 | 48.3% | 50,098 | 17% |
| Property, plant and equipment, net | 33,561 | 27.6% | 29,725 | 13% |
| Other non-current assets | 29,313 | 24.1% | 26,793 | 9% |
| Total assets | 121,722 | 100.0% | 106,616 | 14% |
| Liabilities & Equity | ||||
| Accounts payable & accrued liabilities | 22,238 | 18.3% | 20,495 | 8% |
| Deferred revenue | 7,654 | 6.3% | 6,334 | 21% |
| Current debt & finance leases | 3,116 | 2.6% | 2,823 | 10% |
| Total current liabilities | 33,008 | 27.1% | 29,652 | 11% |
| Non-current debt & finance leases | 8,916 | 7.3% | 7,851 | 14% |
| Other long-term liabilities | 7,665 | 6.3% | 6,423 | 19% |
| Total liabilities | 49,589 | 40.7% | 43,926 | 13% |
| Total equity | 72,133 | 59.3% | 62,690 | 15% |
Balance Sheet Analysis
- Liquidity and Capital ReservesTesla ended 2025 with 36.5 billion in cash, cash equivalents, and investments, representing 30% of total assets. This robust liquidity position provides a significant cushion for upcoming capital expenditures, particularly for AI infrastructure and the launch of the next-generation affordable vehicle platform.
- Asset Efficiency and GrowthNet PP&E grew by 13% year-over-year, reflecting sustained investment in Gigafactory expansions and AI hardware. Notably, inventory and receivables grew by only 3%, significantly lower than the 14% revenue growth, indicating high operational efficiency and disciplined supply chain management.
- Solvency and Capital StructureThe balance sheet remains exceptionally strong with a total debt-to-asset ratio of approximately 10%. With total debt (current and non-current) at roughly 12 billion compared to 36.5 billion in cash, Tesla maintains a substantial net cash position. Equity grew 15% to 72.1 billion, supporting a solid 59.3% equity-to-asset ratio.
- Future Revenue IndicatorsDeferred revenue increased by 21%, primarily driven by FSD software sales. This growth reflects the increasing value of Tesla’s software ecosystem and represents a pool of high-margin revenue that will be recognized as software features are delivered.
Tesla Cash Flow Statement & FCF Analysis (USD in millions)
| Item | Q4 2025 | Q4 2024 | YoY | FY 2025 | FY 2024 |
| Net cash provided by operating activities | 6,290 | 4,370 | 44% | 17,580 | 13,256 |
| Capital expenditures | (3,510) | (2,306) | 52% | (12,410) | (8,899) |
| Free Cash Flow (FCF) | 2,780 | 2,064 | 35% | 5,170 | 4,357 |
| Other investing activities | (512) | 1,215 | N/A | (1,230) | (1,452) |
| Net cash used in investing activities | (4,022) | (1,091) | 269% | (13,640) | (10,351) |
| Net cash used in financing activities | (312) | (706) | -56% | (1,210) | (2,510) |
| Effect of exchange rate changes | 12 | (28) | N/A | (11) | (42) |
| Net increase in cash and equivalents | 1,968 | 2,545 | -23% | 2,719 | 353 |
Free Cash Flow (FCF) Analysis
- Strong Operating Cash Flow GrowthOperating cash flow reached 6.29 billion in Q4 2025, a 44% increase year-over-year. For the full year, it totaled 17.58 billion. This robust growth was driven by higher vehicle delivery volumes and continuous improvements in operational efficiency, despite the competitive pricing environment.
- Strategic Capital Expenditure ExpansionCapital expenditures surged by 40% annually to 12.41 billion in 2025. This significant investment was primarily allocated to:
- AI & Computing: Massive procurement of H100/H200 GPU clusters at Giga Texas.
- Next-Gen Platforms: Preparation of production lines for more affordable vehicle models and the Cybercab.
- Energy Infrastructure: Expansion of Megafactory production capacity to meet global energy storage demand.
- Resilience in Free Cash FlowDespite the record-high capital expenditures, Tesla generated 5.17 billion in FCF for the full year 2025. This capability to self-fund aggressive technological R&D and infrastructure expansion demonstrates a high level of financial independence and reduces the need for external capital markets.
- Disciplined FinancingCash flow from financing activities remained negative at -1.21 billion for the year, primarily reflecting the repayment of debt and lease obligations. Tesla continues to maintain a clean capital structure with minimal reliance on new debt or equity issuance to fund its growth initiatives.
Five-Year Financial Ratio Analysis (2021-2025)
The following analysis tracks Tesla’s financial evolution from its peak automotive margins in 2022 to its current transition into an AI and energy-focused enterprise.
| Financial Ratio | 2025 | 2024 | 2023 | 2022 | 2021 |
| Profitability | |||||
| Gross Margin | 18.0% | 18.2% | 18.2% | 25.6% | 25.3% |
| Operating Margin | 7.3% | 9.2% | 9.2% | 16.8% | 12.1% |
| Net Margin | 7.0% | 15.5% | 15.5% | 15.4% | 10.3% |
| Efficiency | |||||
| Days Sales Outstanding (DSO) | 16 | 15 | 15 | 15 | 15 |
| Days Inventory Outstanding (DIO) | 68 | 66 | 66 | 68 | 66 |
| Solvency & Liquidity | |||||
| Current Ratio | 1.78 | 1.69 | 1.69 | 1.53 | 1.38 |
| Quick Ratio | 1.27 | 1.14 | 1.14 | 1.01 | 0.90 |
| Debt-to-Equity | 0.17 | 0.17 | 0.17 | 0.13 | 0.22 |
Financial Trend Insights
1. Profitability and Margin Compression
Tesla’s margins peaked in 2022 during a period of high vehicle ASPs (Average Selling Prices) and lower lithium costs. The subsequent decline reflects a strategic pivot: prioritizing volume and market share through price adjustments, alongside heavy R&D spending on FSD v13 and the Optimus robot program. The 2025 Net Margin of 7.0% is a “normalized” figure following the 2024 tax-benefit anomaly.
2. Operational Efficiency
Despite doubling revenue since 2021, Tesla has maintained remarkably consistent efficiency metrics. A DSO of 16 days and DIO of 68 days indicate that Tesla’s vertically integrated supply chain and direct-to-consumer model remain highly effective, even as the product lineup (Cybertruck, Megapack) becomes more complex.
3. Strengthening Solvency
Tesla’s liquidity has improved every year. The Current Ratio has risen from 1.38 to 1.78, signaling an increasingly fortress-like balance sheet. With a Debt-to-Equity ratio consistently below 0.2, Tesla is effectively “debt-free” on a net basis (cash exceeds total debt), giving it the flexibility to weather economic cycles without external funding.
4. Strategic Transition
The 2025 data marks a “transition year.” While automotive hardware margins are tighter, the Energy segment’s 51% growth and the steady increase in deferred revenue (related to software) suggest that the company is successfully laying the groundwork for higher-margin AI and service-based revenue streams in 2026 and beyond.
Tesla’s decision to utilize NVIDIA H100 and H200 clusters rather than immediately pivoting to the newest Blackwell (B-series) architecture is a strategic choice focused on speed-to-market and operational scale.
1. Availability and “Compute Now” Strategy
AI training is a race against time. For Tesla to refine FSD v13 and the Optimus robot, they need massive amounts of compute power active today, not six months from now.
- Supply Chain Maturity: While Blackwell chips are technically superior, they are in a state of supply ramp-up and are heavily backordered by hyperscalers. H100s and H200s are readily available in the “tens of thousands” required for Tesla’s Giga Texas cluster.
- Deployment Speed: Building a cluster of 50,000+ GPUs requires specialized cooling, power, and networking. Tesla has already optimized its data center infrastructure for the H-series, allowing them to scale up instantly.
2. The H200 “Sweet Spot” for Video Training
The H200 is not “old” technology; it is the high-bandwidth version of the H100. It features 141GB of HBM3e memory and significantly higher memory bandwidth.
- Video-Centric Training: Tesla’s FSD is trained on massive amounts of video data. In these workloads, memory bandwidth is often more of a bottleneck than raw TFLOPS. The H200 provides the necessary throughput for video-based neural networks without the extreme power/cooling complications of the first-generation Blackwell systems.
3. Infrastructure and Cooling Compatibility
Moving to Blackwell (specifically the GB200 NVL72) often requires a complete overhaul of data center design, involving advanced liquid cooling systems.
- Existing Infrastructure: Tesla has spent billions on the “Cortex” supercomputer at Giga Texas. This facility was designed to maximize the density of H-series chips. Sticking with H100/H200 allows Tesla to achieve massive scale within their current power and cooling envelope rather than waiting to redesign facilities for Blackwell’s higher TDP (Thermal Design Power).
4. The Dojo Complement (Diversification)
Tesla does not want to be 100% dependent on NVIDIA.
- Dual-Track Development: Tesla is simultaneously scaling its own Dojo D1 chips.
- Strategic Allocation: By using NVIDIA’s mature H-series for general-purpose high-performance compute and Dojo for specialized neural network tasks, Tesla maintains a balanced ecosystem. They avoid the “bleeding edge” risks of NVIDIA’s newest chips while still having the world’s most powerful fleet-learning capability.
Summary: Volume over Novelty
Tesla’s goal is to maximize “Total Compute × Utilization Time.”
Getting a massive H200 cluster running at 99% utilization today is more valuable for solving autonomy than waiting for a Blackwell cluster that might take longer to stabilize and deploy at the same scale.
Tesla AI Infrastructure and Compute Scale
Tesla has significantly expanded its AI training capacity at Gigafactory Texas. The deployment includes a massive cluster of NVIDIA H100 and H200 GPUs. This infrastructure supports the training of FSD v13 and the Optimus humanoid robot. The company aims to maintain its position as a leader in real-world AI by scaling its compute power to handle the vast amount of video data collected from its global fleet of over 7 million vehicles.
Financial Investment Figures
The following figures represent the capital and operational commitment to AI and future technologies in 2025:
Research and Development (R&D) Expenses: 4,923 million in 2025 compared to 3,969 million in 2024, representing a 24% increase.
Capital Expenditures (CapEx): 12,410 million in 2025 compared to 8,899 million in 2024, a 40% increase. Much of this growth is attributed to AI hardware procurement and data center construction.
Operating Margin Impact: The increase in AI-related operating expenses contributed to the decline in operating margin from 9.2% in 2024 to 7.3% in 2025.
Operational AI Metrics
FSD Supervised Progress: Version 13 was released to a wider customer base in Q4 2025, showing improved performance in complex urban scenarios through end-to-end neural networks.
Fleet Size for Training: Total vehicle deliveries reached 1.83 million in 2025, bringing the total fleet capable of providing training data to several million units.
Optimus Development: Tesla continues to integrate AI logic across products, with Optimus leveraging the same computer vision and decision-making stacks as FSD.
Strategic Asset Valuation
Deferred Revenue: 7,654 million as of December 31, 2025, which includes unrecognized revenue from FSD software sales. This represents a 21% increase year-over-year, reflecting the growing value of Tesla’s AI software ecosystem.
In Tesla’s financial reporting, Deferred Revenue is a critical indicator of the company’s “hidden” profitability from AI and software. Here is the breakdown of what this means for the 2025 fiscal year:
What is Deferred Revenue?
Deferred revenue represents cash already collected from customers for services that have not yet been fully delivered. Under accounting rules, Tesla cannot recognize this as “Revenue” on the Income Statement until the service is performed; instead, it sits on the Balance Sheet as a liability.
- FSD (Full Self-Driving): This is the largest component. When a customer pays 8,000 for FSD, Tesla recognizes only a portion immediately (roughly 50-60%). The remainder stays in deferred revenue until specific software features (like FSD v13 or unsupervised driving) are released to the fleet.
- Energy Assets: Includes long-term maintenance and warranty contracts for Megapack and Powerwall installations.
- Internet Connectivity: Prepaid subscriptions for in-car data services.
Key Data (As of Dec 31, 2025)
| Metric | Amount (USD) | Change |
| Total Deferred Revenue | 7,654 million | +21% YoY |
| 2024 Comparison | 6,334 million | — |
Why It Matters for Investors
1. Future Profitability Reservoir
Deferred revenue is essentially “pre-sold” software with nearly 100% gross margin. Once Tesla releases the software milestones required to “unlock” this revenue, the majority of that 7.6 billion will flow directly to the bottom line (Net Income) with almost zero additional cost.
2. Offsetting Hardware Price Cuts
As Tesla adjusts vehicle prices to maintain volume, the recognition of deferred revenue acts as a “buffer.” For example, with the wide release of FSD v13 in Q4 2025, Tesla can recognize more of this accumulated cash, helping to stabilize overall operating margins.
3. Interest-Free Financing
Deferred revenue is a source of zero-interest cash flow. Tesla uses this cash today to fund the massive capital expenditures (CapEx) required for its AI data centers and H100/H200 GPU clusters, effectively using customer payments to build its future infrastructure.
4. The “Robotaxi” Indicator
The 21% growth in this liability is actually a positive signal. It shows that more customers are buying into the FSD ecosystem, increasing the pool of high-margin revenue that will be realized as Tesla transitions into a software-defined AI platform.
The following is an analysis of Tesla’s Price-to-Earnings (P/E) Ratio over the last five years (2021-2025):
Five-Year P/E Ratio Data
| Year | Year-End P/E Ratio | Diluted EPS | Approx. Year-End Price | Notes |
| 2021 | 306.7x | 1.63 | 352 | Surge in deliveries; profitability begins to explode. |
| 2022 | 34.8x | 3.62 | 123 | Massive price correction; earnings reach a cyclical peak. |
| 2023 | 73.2x | 3.12 | 248 | Market expectations for AI and Robotaxi drive valuation recovery. |
| 2024 | 100.2x | 3.91 (Incl. tax benefit) | 248 | Includes one-time deferred tax asset recognition. |
| 2025 | 140x – 280x | 2.21 | 400+ | Earnings pressured by R&D; AI optimism pushes valuation higher. |
P/E Trend Analysis
1. 2021-2022: From “Hyper-Growth” to “Reality”
In 2021, the P/E ratio exceeded 300x, reflecting extreme market optimism regarding EV penetration. By 2022, despite EPS more than doubling, the stock price fell sharply due to rising interest rates and demand concerns. This caused the P/E to drop to 34.8x—historically the “cheapest” valuation for Tesla.
2. 2023-2024: Valuation Recovery and Tax Distortions
The recovery to 73x in 2023 indicated that investors began valuing Tesla as an “AI Company” rather than a traditional automaker. Note that the 100x P/E in 2024 is somewhat misleading, as net income was boosted by a one-time non-cash tax benefit of approximately 5.9 billion. Excluding this, the adjusted P/E would have been significantly higher.
3. 2025: The AI and Robotics Premium
A significant divergence occurred in 2025. While automotive margins were squeezed and EPS declined from the 2024 high (normalized), the P/E ratio expanded significantly. This suggests a paradigm shift in market pricing:
- Software Shift: Investors are now pricing in future FSD subscriptions and Robotaxi services rather than just vehicle volume.
- Compute as an Asset: Tesla’s massive H100/H200 compute clusters are being valued as growth engines, commanding a premium similar to big-tech AI players.
4. Comparison with Peers
Compared to legacy automakers like GM or Ford, which typically trade at P/E ratios below 10x, Tesla’s 100x+ valuation indicates high growth expectations coupled with high risk. This means the stock remains sensitive to any perceived delays in FSD progress or AI commercialization.
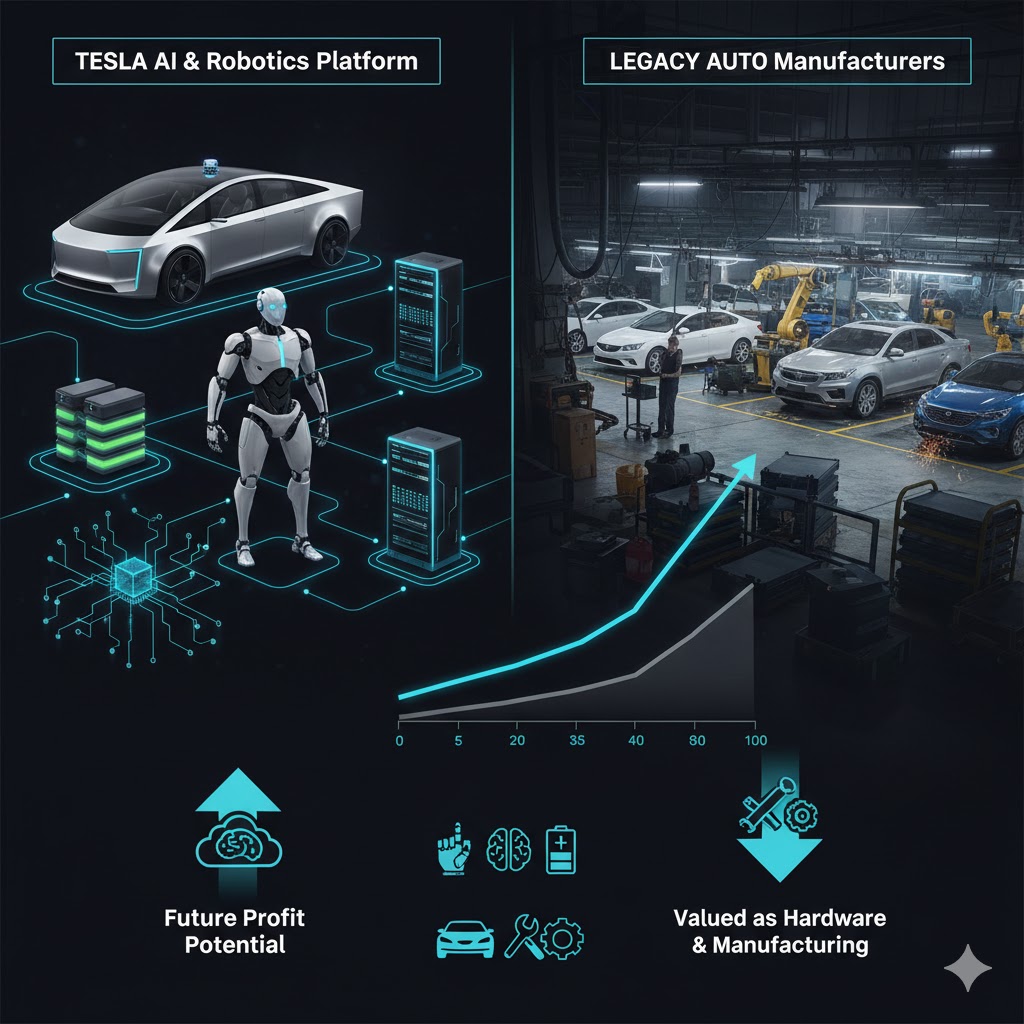
Comparing Tesla (TSLA) to the traditional automotive industry reveals a massive valuation gap. While legacy car companies are valued as mature, cyclical industrial entities, the market values Tesla as a high-growth AI and technology platform.
As of early 2026, here is how the numbers stack up:
P/E Ratio Comparison (2025-2026 Estimates)
| Category / Company | Approx. P/E Ratio | Market Perception | Primary Value Drivers |
| Legacy Auto Average | 8x – 12x | Cyclical Industrial | Manufacturing scale, units sold |
| Toyota (TM) | ~9.5x | Stable, Hybrid Leader | Global volume, production efficiency |
| General Motors (GM) | ~7.5x | Transitioning Legacy | North American trucks, Cruise (AV) |
| EV / New Energy Average | 15x – 30x | Growth Industrial | Market share, vertical integration |
| BYD (BYDDF) | ~19x | Manufacturing Powerhouse | Battery dominance, vertical integration |
| Tesla (TSLA) | 140x – 280x | AI / Robotics Platform | FSD, Robotaxi, Optimus, Energy |
Why is Tesla’s P/E 10x-20x Higher than the Industry?
The market grants Tesla this “valuation premium” because it doesn’t look at it as a car company. The core reasons include:
1. The “Software-as-a-Service” (SaaS) Model
Legacy automakers have low margins (typically 5-10%) and rely on one-time hardware sales. Tesla is valued more like a software company because of its FSD (Full Self-Driving) subscriptions.
Investors believe that as autonomy matures, Tesla will generate recurring, high-margin software revenue that has nearly zero marginal cost, justifying a tech-like multiple.
2. AI Infrastructure as a Core Asset
In 2025 and 2026, the narrative shifted heavily toward Compute Power. Tesla’s massive clusters of NVIDIA H100/H200 GPUs and its proprietary Dojo supercomputer are seen as independent assets. While Ford and GM are trying to figure out EV manufacturing, Tesla is being valued as one of the world’s most powerful “Real-World AI” laboratories.
3. “Optionality” of Future Products
Tesla’s P/E ratio prices in several “options” that have yet to hit full-scale profitability:
- Robotaxi (Cybercab): The potential for an autonomous ride-hailing fleet that yields significantly higher profit per mile than selling a car.
- Optimus (Humanoid Robot): The addressable market for general-purpose labor is viewed as virtually infinite by bulls.
- Energy Storage: Tesla’s Megapack business is growing faster than its automotive segment and carries higher margin potential.
4. The “Execution Premium”
The market pays a premium for Elon Musk’s track record of achieving “impossible” engineering feats (e.g., SpaceX’s Starship or Tesla’s 4680 cells). This trust allows the stock to trade at a multiple that assumes future breakthroughs are a certainty rather than a possibility.
The Risk of the “Valuation Chasm”
The massive gap between Tesla’s 100x+ P/E and the industry’s 10x means there is zero room for error.
- Earnings Sensitivity: If Tesla’s delivery growth in 2026 falls below the expected 20-30%, the P/E ratio could contract sharply, leading to a significant stock price correction even if the company remains profitable.
- Regulatory Speed: If the deployment of Robotaxis is delayed by regulators, the “AI premium” could erode, forcing the stock to be re-evaluated on its automotive fundamentals.
In the financial landscape of 2025 and early 2026, the gap between Tesla and legacy automakers (Toyota, GM, Ford) in terms of margins has tightened significantly. While Tesla used to enjoy “tech-like” margins, it is now facing the harsh realities of the automotive price war.
2025 Margin Comparison (Estimates)
| Metric | Tesla | Toyota | GM | Ford |
| Gross Margin | 18.0% | 19.8% | 12.5% | 10.5% |
| Operating Margin | 7.3% | 11.5% | 7.4% | 4.2% |
| Net Profit Margin | 7.0% | 9.8% | 7.4% | 3.8% |
Key Differentiators
1. The “Gross Margin” Convergence
Historically, Tesla boasted gross margins above 25%. However, in 2025, Toyota surpassed Tesla in gross profitability. This is largely because Toyota’s Hybrid strategy has matured into a highly profitable, lower-cost segment compared to pure EVs. Tesla’s margins have been squeezed by aggressive price cuts intended to maintain market share and the high initial production costs of the Cybertruck.
2. Operating Efficiency vs. R&D Intensity
Tesla’s operating margin (7.3%) is now lower than Toyota’s and roughly equal to GM’s. The reason is R&D intensity.
- Tesla plows about 5% to 17% of its revenue back into R&D (specifically AI, Dojo, and Optimus).
- Legacy Automakers typically spend 3% to 5% on R&D.This heavy investment in the future (AI) acts as a drag on Tesla’s current earnings but is the primary reason it maintains its massive valuation premium.
3. Net Margin & Revenue Quality
- Toyota & GM: Their net margins are supported by steady “cash cow” businesses—internal combustion engine (ICE) trucks and hybrids.
- Tesla: Its 7.0% net margin is increasingly supported by Energy Storage (with margins estimated at 30%+) and FSD service recognition, rather than just selling the hardware of the car.
Summary: Stable Past vs. Volatile Future
Legacy automakers currently show superior profitability stability. Toyota, in particular, has proven that the hybrid transition is the most profitable path in the current market.
Tesla’s lower current margins reflect a strategic pivot. The company is deliberately sacrificing short-term hardware profit to build the world’s largest AI-capable fleet. Investors aren’t buying Tesla for its current 7% net margin; they are betting that once the “AI Flip” happens (unsupervised FSD/Robotaxi), the margins will leap from 7% to over 50%.
Source:
Also check: