Shell Q4 and Full Year 2025 Financial Results Summary
Financial Performance
Shell reported full-year 2025 adjusted earnings of 18.5 billion, a decrease from 23.7 billion in 2024. For the fourth quarter, adjusted earnings reached 3.3 billion, down from 5.4 billion in Q3 2025. This decline was primarily driven by lower commodity prices and higher tax charges, although performance was supported by strong operational delivery in the Upstream and Integrated Gas segments. Cash flow from operating activities (CFFO) remained resilient at 42.9 billion for the full year.
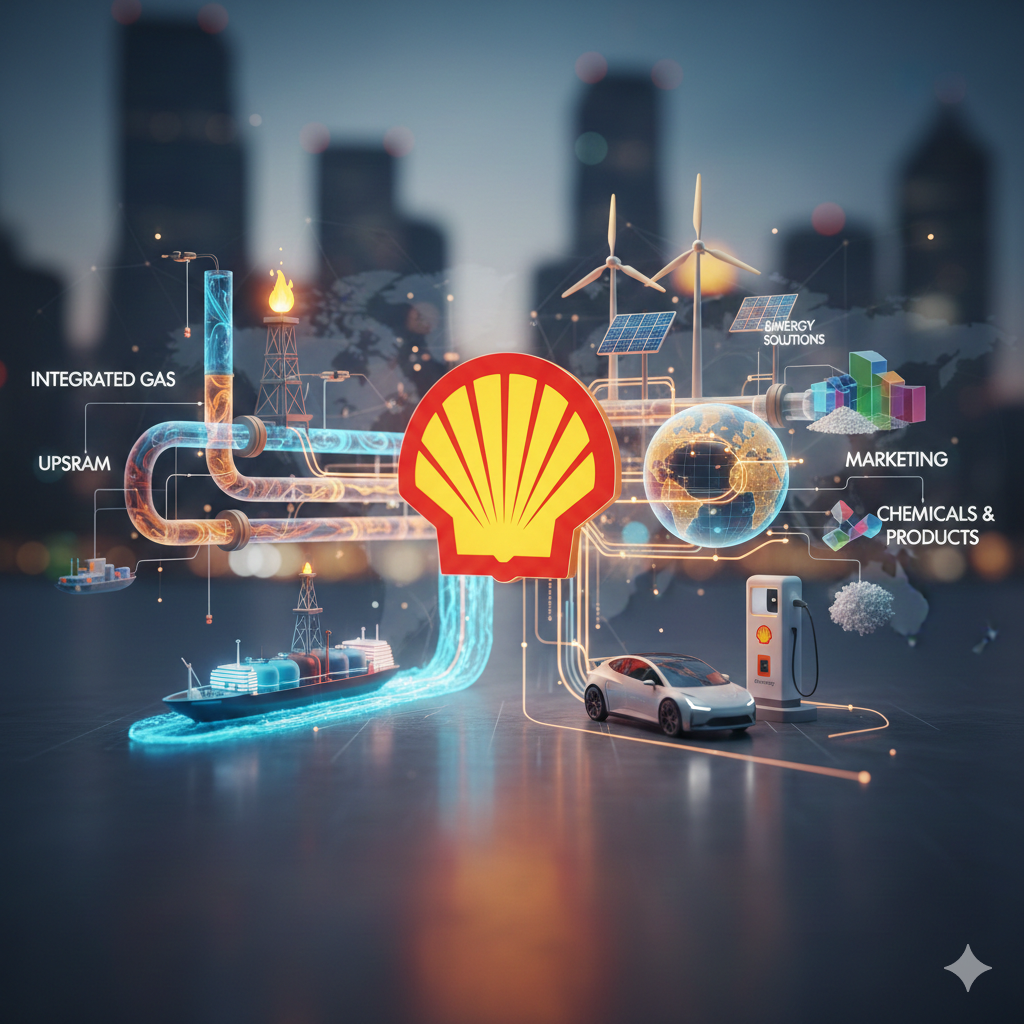
Segment Highlights
Integrated Gas and Upstream continued to be the primary profit drivers. Integrated Gas benefited from higher liquefaction and sales volumes, which helped offset lower realized prices. However, the Chemicals and Products segment faced challenges, recording a loss in Q4 due to continued weakness in chemical margins and seasonally lower trading results. The Renewables and Energy Solutions segment maintained stable earnings compared to the previous quarter.
Shareholder Returns and Costs
The company announced a 4% increase in its quarterly dividend to 0.372 per share and initiated a new 3.5 billion share buyback program to be completed by the Q1 2026 results. Shell also achieved significant efficiency gains, delivering 5.1 billion in structural cost reductions since 2022, meeting its targets ahead of schedule.
Strategic Portfolio Actions
Throughout 2025, Shell simplified its portfolio by exiting several non-core assets, including onshore operations in Nigeria, Canadian oil sands, and the Singapore chemicals and refinery site. Simultaneously, it strengthened its core positions through the Pavilion Energy acquisition and increased equity in various deepwater projects. Cash capital expenditure for 2025 was 20.9 billion, with a similar outlook of 20 to 22 billion projected for 2026.
Shell Strategic Outlook and Guidance
Operational and Production Outlook
For the first quarter of 2026, Integrated Gas production is expected to be between 920 and 980 kboe/d, with LNG liquefaction volumes projected at 7.4 to 8.0 million tonnes. Upstream production is guided at 1,700 to 1,900 kboe/d, reflecting the incorporation of the Adura joint venture. Marketing sales volumes are forecasted at 2,550 to 2,750 kb/d, while refinery utilization is targeted between 90% and 98%.
Capital Expenditure and Cost Efficiency
Shell maintains a disciplined approach to capital allocation, with cash capital expenditure for the full year 2026 projected to be in the range of 20 to 22 billion. Having already achieved 5.1 billion in structural cost reductions since 2022, the company intends to pursue further cost efficiencies to enhance profitability.
Shareholder Returns
The commitment to shareholder value remains a priority. Following the 4% dividend increase, the company has launched a 3.5 billion share buyback program scheduled for completion by the time of the Q1 2026 results announcement. This continues a trend of at least 3 billion in buybacks for 17 consecutive quarters.
Portfolio Strategy and Energy Transition
Shell will continue to high-grade its portfolio by focusing on high-margin Integrated Gas and Deepwater Upstream projects. The company remains committed to its strategic shift toward simplified operations and disciplined growth, balancing energy transition goals with the necessity of delivering strong cash flow in a fluctuating macro environment.
Based on financial data from 2021 to 2025, Shell’s financial ratios over the past five years reflect a strong post-pandemic recovery and a strategic pivot toward capital efficiency amidst the energy transition.
Profitability Analysis
Shell’s profitability metrics are highly correlated with global oil prices (e.g., Brent), but under CEO Wael Sawan, the focus has shifted heavily toward Return on Average Capital Employed (ROACE).
- Return on Equity (ROE): Driven by the surge in energy prices due to geopolitical events, ROE reached a historical peak of approximately 22% in 2022. It normalized to the 9%-10% range in 2023-2024. Despite a softer macro environment in 2025, it maintained a steady level of around 10.4%.
- Return on Average Capital Employed (ROACE): This is Shell’s most critical KPI. It exceeded 20% in 2022, stood at 12.8% in 2024, and settled at approximately 9.4% in 2025 due to lower earnings. The company aims to maintain this in the double digits through structural cost reductions and portfolio optimization.
Liquidity and Financial Structure
Shell has focused on deleveraging over the past five years, significantly strengthening its balance sheet.
- Gearing Ratio: This measure of net debt as a percentage of total capital has improved drastically. From over 30% in 2020, it dropped to 20.7% by the end of 2025, providing the company with the financial flexibility to execute large-scale share buybacks.
- Current Ratio: This has remained stable between 1.30 and 1.40 over the past five years, indicating healthy short-term liquidity and the ability to meet immediate obligations.
Shareholder Returns and Valuation
- Dividends and Buybacks: Shell’s policy is to distribute 30% to 40% of its Cash Flow from Operations (CFFO) to shareholders. In 2025, the actual distribution reached approximately 52% of CFFO through a combination of dividends and aggressive share buybacks.
- Price-to-Earnings (P/E) Ratio: Valuation has fluctuated significantly. The P/E was elevated in 2021 (around 37x) during the initial recovery, compressed to 9.6x in 2022 as earnings soared, and sat between 11.7x and 14.9x by the end of 2025, reflecting market pricing of its transition strategy.
Five-Year Financial Ratio Trend Summary
| Metric | 2021 | 2022 | 2023 | 2024 | 2025 |
| ROE | 11.7% | 22.2% | 10.4% | 9.0% | 10.4% |
| ROACE | 8.0% | 20.0% | 11.1% | 12.8% | 9.4% |
| Gearing Ratio | 23.1% | 23.0% | 18.8% | 17.7% | 20.7% |
| Current Ratio | 1.35 | 1.37 | 1.40 | 1.30 | 1.30 |
| P/E Ratio | 37.4 | 9.6 | 10.0 | 8.9 | 11.7-14.9 |
Shell’s current financial strategy has pivoted from “expansion” to “discipline,” utilizing a strict 20-22 billion annual capital expenditure ceiling and continuous cost-cutting (achieving 5.1 billion in reductions by 2025) to ensure stable shareholder returns despite market volatility.
Back to Shell page