SAP (Systemanalyse und Programmentwicklung) has evolved from a five-person startup in 1972 into the world’s leading provider of enterprise software. Its history is generally categorized into several distinct technological eras:
Phase 1: The Founding and R/1 (1972–1979)
Five former IBM engineers founded SAP in Mannheim, Germany, with the vision of creating standard application software for real-time data processing.
- 1973: Launched SAP R/1 (the “R” stands for Real-time).
- Unlike other software of that era which processed data in batches (overnight), R/1 allowed data to be processed as it was entered, focusing primarily on financial accounting.
Core Technology: 1-Tier Architecture. All processing and data storage occurred on a single mainframe, accessed via local terminals.
Core Strategy: Real-time Processing. SAP challenged the industry standard of “batch processing” by offering immediate data updates, specifically focusing on standardized financial accounting software.
Revenue Level: Startup Stage. Revenue grew from approximately 5.2 million DM in 1975 to about 10 million DM by 1979.
Phase 2: The Mainframe Era and R/2 (1979–1992)
As computing power grew, SAP developed a system capable of handling high-volume processing on IBM mainframes.
- 1979: Launched SAP R/2.
- This version introduced multi-language and multi-currency capabilities, enabling SAP to expand across Europe. It integrated various business functions like logistics, manufacturing, and HR.
Core Technology: 2-Tier Architecture. This era utilized high-performance mainframes to manage centralized databases while handling application logic separately.
Core Strategy: Standardization and Internationalization. SAP expanded into logistics, manufacturing, and HR modules. The strategy focused on multi-language and multi-currency capabilities to support global expansion.
Revenue Level: High Growth. Revenue crossed the 100 million DM mark in 1985 and reached approximately 500 million DM by 1990.
Phase 3: Client-Server Architecture and R/3 (1992–2004)
This was the “Golden Age” of SAP, coinciding with the shift from mainframes to PCs and servers.
- 1992: Launched SAP R/3, utilizing a three-tier client-server architecture (Database, Application, and Presentation).
- The system was highly portable across different hardware platforms and databases.
- The late 90s saw the launch of mySAP platform, shifting the focus toward the internet and e-commerce.
Core Technology: 3-Tier Architecture. This revolutionary shift separated the Database, Application Server, and Presentation Layer (GUI), allowing the system to run on diverse hardware platforms like Unix and Windows NT.
Core Strategy: Global Dominance and Ecosystem Building. SAP capitalized on the Y2K crisis to drive system replacements and partnered with global consulting firms to become the de facto standard for Fortune 500 companies.
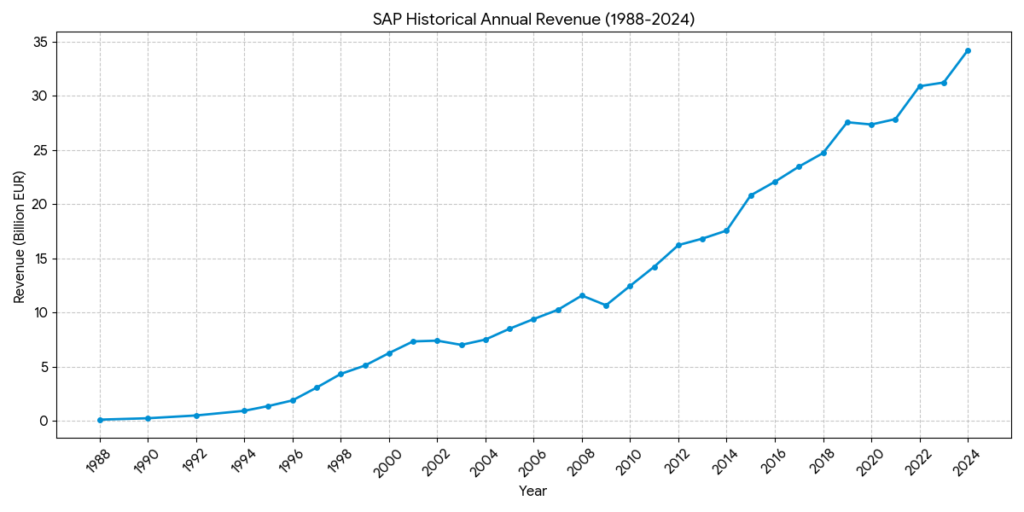
Revenue Level: Explosive Expansion. Revenue hit 1 billion DM in 1992. By 2000, after the transition to the Euro, revenue reached approximately €6.3 billion.
Phase 4: SAP ERP and NetWeaver (2004–2015)
SAP moved toward a Service-Oriented Architecture (SOA) to allow better integration with non-SAP applications.
- 2004: Released SAP ERP 6.0 (also known as SAP ECC), which became the most widely used ERP core in history.
- The SAP NetWeaver platform was introduced as the technical foundation, allowing businesses to integrate data and processes from different sources.
Core Technology: NetWeaver Platform. Introduced Service-Oriented Architecture (SOA) and Web integration, allowing SAP systems to communicate more easily with third-party applications.
Core Strategy: Product Diversification and M&A. SAP moved beyond its core ERP engine through strategic acquisitions (e.g., Business Objects for analytics, SuccessFactors for HR) to offer a broader suite of business tools.
Revenue Level: Steady Maturity. Revenue grew from approximately €8.5 billion in 2005 to €17.5 billion by 2014.
Phase 5: The In-Memory Revolution and S/4HANA (2015–Present)
To address the challenges of Big Data and digital transformation, SAP reinvented its core engine.
- 2011: Introduced SAP HANA, a revolutionary in-memory database that processes data in RAM rather than on a hard disk.
- 2015: Launched SAP S/4HANA, the next-generation ERP suite written specifically for the HANA database. It features a simplified data model and a modern user experience called SAP Fiori.
- Current Focus: The “RISE with SAP” initiative, which focuses on transitioning legacy on-premise customers to the cloud (S/4HANA Cloud).
Core Technology: SAP HANA In-Memory Database. Data is processed in RAM for massive speed gains, combined with the Fiori mobile user interface and integrated Business AI.
Core Strategy: Cloud-First and Subscription Model. Through initiatives like “RISE with SAP,” the company is migrating customers from one-time licenses to recurring cloud subscriptions, focusing on becoming an “Intelligent Enterprise.”
Revenue Level: Record Highs with Transition. Revenue reached approximately €20 billion in 2015. By 2024, revenue exceeded €31 billion, with Cloud revenue now serving as the primary growth engine.
Technical Competitive Analysis: SAP vs. Oracle vs. Microsoft (2026)
In 2026, the technical battleground has shifted from simple feature parity to Data Architecture, Platform Extensibility (PaaS), and the depth of AI Orchestration.
1. Data Processing & Architecture
- SAP (HANA In-Memory)
- Technical Edge: Uses a columnar, in-memory database that eliminates the need for separate OLTP (Transaction) and OLAP (Analytics) layers. This allows for massive parallel processing of complex business logic (e.g., real-time MRP or global financial consolidation).
- Differentiator: “Single Source of Truth.” There is zero data latency between a transaction occurring and it appearing in a strategic dashboard.
- Constraint: High hardware/RAM overhead and a rigid data schema compared to more flexible cloud-native databases.
- Oracle (Autonomous Database & OCI)
- Technical Edge: Features self-healing, self-securing, and self-tuning capabilities. Oracle’s OCI (Oracle Cloud Infrastructure) is optimized specifically for database performance.
- Differentiator: Superior automation in database management, reducing human error and DBA costs significantly compared to the manual tuning often required for HANA.
- Microsoft (Dataverse & Azure Synapse)
- Technical Edge: Leverages a highly flexible, common data model (Dataverse) that allows seamless data flow between ERP, CRM, and Office apps.
- Differentiator: Best-in-class data democratization. It is technically easier for a business user to pull ERP data into an Excel sheet or Power BI dashboard than in the SAP ecosystem.
2. Extensibility and PaaS (Platform as a Service)
- SAP Business Technology Platform (BTP)
- Philosophy: “Keep the Core Clean.” Extensions are built on BTP rather than modifying the ERP source code.
- Technical Strength: Deep integration with SAP-specific metadata and industry-specific APIs. It is the most robust platform for maintaining “standardized” global processes while allowing localized innovation.
- Microsoft Power Platform
- Philosophy: “Low-Code/No-Code Empowerment.”
- Technical Strength: Boasts the largest library of pre-built connectors in the world. Its logic is based on the familiar “if-this-then-than” structure, making it the most accessible platform for rapid application development.
3. Generative AI & Autonomous Agents
- SAP (Joule & Business AI)
- Mechanism: Joule is grounded in the SAP “Business Context.” It doesn’t just process text; it understands the underlying data relationships (e.g., how a purchase order relates to a specific supplier’s historical reliability).
- 2026 Focus: Agentic AI—autonomous agents that can handle end-to-end tasks like “dispute resolution” or “automated stock reordering” based on real-time sensor data.
- Microsoft (Copilot)
- Mechanism: Powered by OpenAI’s latest models integrated directly into the UI (Excel, Teams, Outlook).
- Technical Strength: Superior natural language interface. While SAP wins on “deep process AI,” Microsoft wins on “personal productivity AI,” making the software feel much more intuitive to the end-user.
Summary of Technical Positioning
| Technical Dimension | SAP S/4HANA | Oracle Cloud ERP | Microsoft Dynamics 365 |
| Data Engine | HANA (High-speed In-Memory) | Autonomous (Self-Tuning) | SQL/Dataverse (High Flexibility) |
| Integration Pattern | Deep API/OData (Rigid/Stable) | REST/SOAP (Broad/Adaptable) | Power Automate (User-Centric) |
| AI Strategy | Contextual Business AI | Operational Automation AI | Generative Productivity AI |
| System Complexity | High (High technical debt) | Medium | Low to Medium |
Application Competitive Analysis: SAP vs. Oracle vs. Microsoft (2026)
In 2026, the application-level competition has moved beyond “which system has more features” to “how well does the system automate complex human decisions?” and “how seamlessly does it fit into the user’s daily workflow?”
1. Core Domain Strengths & Industry Fit
The “Big Three” have carved out distinct territories based on their application depth:
- SAP S/4HANA (The Global Industrial Standard):
- Application Depth: Unmatched in Supply Chain Management (SCM) and Advanced Manufacturing. SAP remains the only system capable of handling the extreme complexity of automotive, aerospace, and pharmaceutical industries, where compliance and global multi-entity consolidation are non-negotiable.
- Best For: Large-scale global organizations that prioritize rigid process standardization and deep regulatory compliance over agility.
- Oracle Cloud ERP (The Financial Powerhouse):
- Application Depth: Dominates in Enterprise Performance Management (EPM) and Financial Planning. Oracle’s applications feel more cloud-native and are often preferred by finance leaders for their superior automated closing and predictive cash-flow forecasting tools.
- Best For: Finance-centric organizations, professional services, and tech companies that require rapid scalability and high-level financial automation.
- Microsoft Dynamics 365 (The Ecosystem Integrator):
- Application Depth: Excels in Front-to-Back Office integration. Its killer application is the seamless transition between CRM (Sales) and ERP (Finance/Supply Chain). Because the UI is virtually identical to Office 365, user adoption rates are significantly higher than SAP or Oracle.
- Best For: Mid-to-large enterprises looking for high “Time-to-Value,” lower TCO, and a unified experience with Teams and Outlook.
2. The “AI-in-Action” Experience
The 2026 application experience is defined by how AI (Joule vs. Copilot vs. Oracle AI) is triggered:
- SAP (Contextual Action): Joule is deeply woven into “Action-Oriented” workflows. For example, in a procurement app, Joule doesn’t just chat; it proactively identifies a supplier risk and offers to re-route the purchase order based on real-time logistics data.
- Microsoft (Collaborative Productivity): Copilot dominates “Knowledge-Oriented” tasks. It allows users to query ERP data directly from a Teams meeting or summarize an entire vendor’s performance history into a PowerPoint slide with a single command.
- Oracle (Operational Intelligence): Focuses on “Invisible AI.” It emphasizes automating the “boring” parts of the application, such as 98%+ accuracy in automated invoice matching and intelligent exception handling without human intervention.
3. Practical Comparison Table (2026)
| Application Aspect | SAP S/4HANA | Oracle Cloud ERP | Microsoft Dynamics 365 |
| Best Feature | Real-time Supply Chain (MRP) | Automated Financial Closing | CRM-ERP Synergy |
| User Experience | Fiori (Task-specific, deep) | Modern, Web-native, Intuitive | Familiar, Office-integrated |
| Industry Strength | Manufacturing, Pharma, Retail | Finance, Tech, Banking | Services, Distribution, SMB+ |
| Implementation | Complex (12-24 months) | Moderate (9-15 months) | Agile (6-12 months) |
| AI Focus | Autonomous Business Processes | Financial Predictive Insights | Employee Productivity & Tools |
4. The 2026 “Cloud Trap” Warning
A critical application-level trend in 2026 is the “End of Maintenance” pressure. SAP is aggressively pushing its ECC (legacy) customers to S/4HANA before the 2027 deadline. This has created a “buyer’s market” where Oracle and Microsoft are offering significant “migration credits” to lure frustrated SAP customers who find the S/4HANA application transition too costly or complex.
ERP Market Share Analysis (2026)
In 2026, the ERP market share is measured through two primary lenses: Revenue Share (financial dominance) and Install Base/Customer Count (market penetration). While SAP remains the “titan” of large-scale enterprises, Oracle and Microsoft have significantly altered the landscape.
1. Revenue-Based Market Share (The Financial Leaders)
By revenue, Oracle has established a slight lead over SAP, driven by its cloud-native architecture and successful industry-specific acquisitions (such as Cerner for healthcare).
- Oracle (6.6% – 6.7%): Leading the market with approximately $8.7 billion in annual ERP-specific revenue. Its growth is fueled by high-margin cloud subscriptions and embedded “Agentic AI” within its financial modules.
- SAP (6.5% – 6.6%): Follows closely with roughly $8.6 billion. SAP’s strategy focuses on migrating its massive on-premise base to the cloud via the “RISE with SAP” program, which has seen a 30%+ surge in cloud suite revenue.
- Microsoft (3% – 4%): While lower in direct ERP revenue compared to the giants, it is the fastest-growing major vendor, leveraging its OpenAI partnership to dominate the “AI-enabled ERP” conversation.
2. Customer Count & Install Base (The Volume Leaders)
If we measure by the number of companies using the platform, the ranking shifts toward vendors serving the mid-market and SMB segments.
- Microsoft Dynamics (~24.1%): The clear leader in volume with over 61,000 customers. Its dominance is rooted in its seamless integration with the Microsoft 365 ecosystem, making it the default choice for mid-sized firms.
- Workday (~12.6%): With over 32,000 customers, it has a massive footprint in service-centric industries and Human Capital Management (HCM).
- SAP (Combined ~20.9%):
- SAP ERP (Legacy): ~10.9% (approx. 27,800 customers).
- SAP S/4HANA: ~10.0% (approx. 25,700 customers).
- Note: While SAP has fewer total customers than Microsoft, its revenue per customer is significantly higher due to its focus on Fortune 500 companies.
3. Strategic Comparison of Market Positioning
| Metrics | SAP | Oracle | Microsoft |
| Market Segment | Global 500, Manufacturing | Large Enterprise, Finance, Healthcare | Mid-market, Professional Services |
| Growth Engine | “RISE with SAP” (Cloud Migration) | “Agentic AI” & Industry Cloud | Copilot AI & Office 365 Synergy |
| Regional Lead | Europe & APAC | North America | North America & SMB Global |
| Dominant Edge | Complex Supply Chain depth | Automated Financial Closing | Low-Code & User Adoption |
4. Critical 2026 Trends
- Cloud Dominance: Over 70% of new ERP implementations in 2026 are cloud-based. Pure on-premise deployments are now reserved for highly regulated government or defense sectors.
- The “SME” Surge: Small and Medium Enterprises are expected to contribute over 50% of global ERP growth in 2026, a segment where Microsoft and Oracle NetSuite currently outperform SAP’s high-entry-cost S/4HANA.
- The 2027 Deadline: SAP is facing a critical juncture as its legacy ECC maintenance deadline approaches in 2027. This has created a “Clash of the Titans” where Oracle and Microsoft are aggressively offering migration incentives to capture departing SAP clients.
Source:
- Gartner Magic Quadrant for Cloud ERP (2025/2026): https://www.gartner.com/en/documents/4514312
- Oracle vs SAP Technical Deep Dive (2026 Edition): https://www.oracle.com/erp/oracle-vs-sap/
- SAP BTP Strategy 2026: https://www.sap.com/products/technology-platform.html
- Apps Run The World ERP Forecast 2024-2029: https://www.appsruntheworld.com/
- 6sense ERP Market Technology Report 2026: https://6sense.com/tech/erp
- Fortune Business Insights ERP Size & Share 2026: https://www.fortunebusinessinsights.com/
back to SAP page