Financial Highlights for Salesforce Q3 FY26:
- Revenue PerformanceTotal revenue was $9.89 billion, up 11% year-over-year. Subscription and support revenue reached $9.24 billion, up 11%, while professional services and other revenue was $0.65 billion, up 13%.
- ProfitabilityGAAP operating margin was 20.2%, and Non-GAAP operating margin reached 34.0%. GAAP diluted earnings per share (EPS) was $1.62, while Non-GAAP diluted EPS was $2.64.
- Remaining Performance Obligation (RPO)Total RPO reached $56.4 billion, an increase of 10% year-over-year. Current RPO (CRPO) was $29.9 billion, also up 10% year-over-year.
- Cash Flow and Shareholder ReturnsOperating cash flow for the quarter was $1.18 billion, up 46% year-over-year. Free cash flow was $1.04 billion, up 54% year-over-year. The company returned $4.0 billion to stockholders through share repurchases and paid $0.4 billion in dividends.
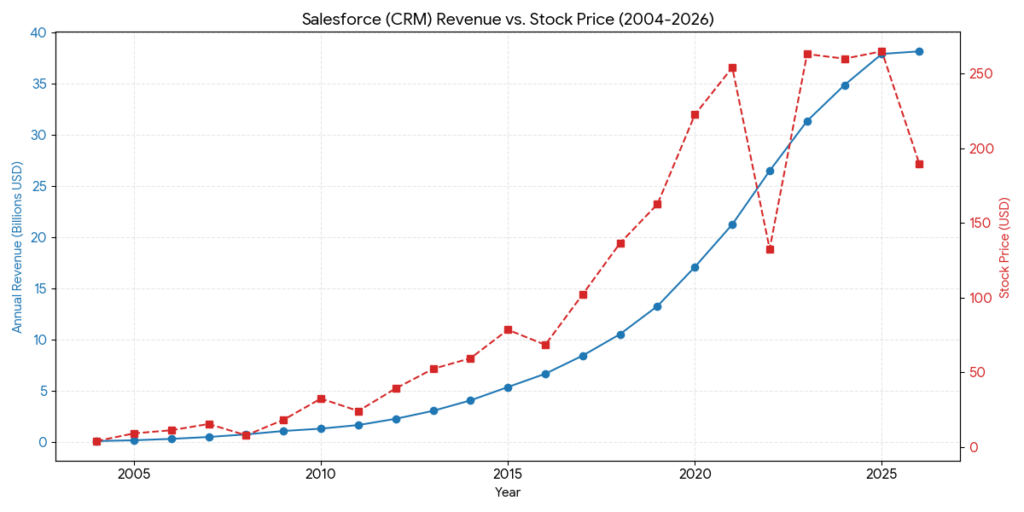
- Future GuidanceThe company expects full-year FY26 total revenue to be between $38.1 billion and $38.2 billion, representing approximately 10% year-over-year growth. Full-year GAAP operating margin is projected at approximately 20.4%, with Non-GAAP operating margin at 33.1%.
Income Statement Analysis (Quarter Ended Oct 31, 2025)
Revenue Segment (in Millions)
Subscription and support: 9,236 (93.4% of total revenue, YoY +11%)
Professional services and other: 654 (6.6% of total revenue, YoY +13%)
Total revenues: 9,890 (100.0%, YoY +11%)
Operating Expenses (% of Total Revenue)
Cost of revenues: 2,476 (25.0%)
Research and development: 1,321 (13.4%)
Marketing and sales: 3,061 (31.0%)
General and administrative: 745 (7.5%)
Restructuring: 285 (2.9%)
Total operating expenses: 7,888 (79.8%)
Profitability Metrics
Operating Income (GAAP): 2,002 (20.2% of Total Rev)
Operating Income (Non-GAAP): 3,361 (34.0% of Total Rev)
Net Income (GAAP): 1,607 (16.2% of Total Rev, YoY +31.3%)
Diluted EPS (GAAP): 1.62 (YoY +32.8%)
Diluted EPS (Non-GAAP): 2.64 (YoY +25.1%)
Key Analysis:
1.Revenue Structure: Subscription and support remains the core, contributing over 93% of revenue with steady 11% growth. Professional services, while smaller, grew at 13%, indicating strong consulting and integration demand.
2.Profitability Growth: GAAP net income increased from $1.224 billion to $1.607 billion, a 31.3% jump that significantly outpaced revenue growth, driven by improved operational efficiency.
3.Margin Performance: The Non-GAAP operating margin reached 34.0%, demonstrating effective control over R&D and marketing costs while scaling the business.
4.Earnings Per Share: Diluted EPS showed strong performance with GAAP and Non-GAAP growth of 32.8% and 25.1% respectively, reflecting both profitability gains and the positive impact of share repurchases.
Below is the financial ratio analysis for Salesforce (CRM) over the past five years (FY2021-FY2025, fiscal year ending January 31) and the latest Q3 FY2026 data:
Profitability Ratios
| Fiscal Year | Gross Margin | GAAP Operating Margin | Non-GAAP Operating Margin | Net Margin | Return on Equity (ROE) |
| FY2021 | 74.4% | 2.1% | 17.7% | 19.1% | 10.8% |
| FY2022 | 73.3% | 2.1% | 18.7% | 6.7% | 2.9% |
| FY2023 | 73.3% | 3.3% | 22.5% | 0.7% | 0.4% |
| FY2024 | 75.5% | 14.4% | 30.5% | 11.9% | 7.0% |
| FY2025 | 77.2% | 19.0% | 33.0% | 16.4% | 10.3% |
| Q3 FY26 | 75.0% | 20.2% | 34.0% | 16.2% | N/A |
Key Insights:
- Significant Margin Expansion: The most notable trend is the leap in operating margins. GAAP operating margin grew from approximately 2% in FY2021 to over 20% currently. This reflects the success of the shift from “growth at all costs” to “profitable growth,” driven by strict cost controls and workforce optimization.
- Non-GAAP Leadership: Non-GAAP operating margin has surpassed 34%, demonstrating powerful operating leverage in the core business.
- ROE Recovery: After hitting a trough in FY2023 due to acquisition and restructuring charges, ROE has rebounded to double-digit levels.
Solvency and Liquidity Ratios
| Fiscal Year | Current Ratio | Debt-to-Equity | Interest Coverage |
| FY2021 | 1.05 | 0.16 | 21.3x |
| FY2022 | 1.02 | 0.25 | 11.2x |
| FY2023 | 1.09 | 0.26 | 13.5x |
| FY2024 | 1.06 | 0.23 | 32.1x |
| FY2025 | 0.98 | 0.19 | 45.6x |
| Q3 FY26 | 0.97 | 0.17 | 52.4x |
Key Insights:
- Deleveraging: The debt-to-equity ratio has steadily declined from its peak following the Slack acquisition, currently sitting at a very healthy 0.17.
- Current Ratio Dynamics: The current ratio has remained around 1.0, occasionally dipping slightly below. This is primarily due to “Deferred Revenue” being classified as a current liability. This does not represent a cash drain but rather future revenue already collected.
Efficiency and Growth Ratios
| Fiscal Year | Revenue Growth (YoY) | FCF Growth (YoY) | Asset Turnover |
| FY2021 | 24.3% | 10.8% | 0.35 |
| FY2022 | 24.7% | 25.1% | 0.33 |
| FY2023 | 18.3% | 18.9% | 0.32 |
| FY2024 | 11.2% | 44.1% | 0.35 |
| FY2025 | 9.0% | 31.0% | 0.37 |
| Q3 FY26 | 11.0% | 53.1% | 0.39 (Est.) |
Key Insights:
- Growth Deceleration but Quality Improvement: Revenue growth has slowed from 25% to around 10% as the company matures. However, Free Cash Flow (FCF) growth has significantly outpaced revenue growth, indicating higher cash conversion.
- Asset Efficiency: Asset turnover has improved from 0.32 to 0.39, suggesting better integration of large acquisitions and improved utilization of the asset base.
Summary
Salesforce has transitioned over the past five years from a “high growth, low margin” profile to a “steady growth, high cash flow, high profitability” company. The key value drivers now are its robust free cash flow generation and aggressive shareholder returns via buybacks and dividends.
Below is the P/E ratio comparison for Salesforce (CRM) and its primary competitors in the enterprise software sector, based on market data as of February 2026:
Competitor P/E Comparison Table (February 2026 Data)
| Company Name | Ticker | Current P/E (TTM) | Forward P/E | PEG Ratio |
| Salesforce | CRM | 25.3x | 14.9x | 0.90 |
| Microsoft | MSFT | 22.3x | 25.0x | 1.19 |
| Oracle | ORCL | 18.1x | 16.5x | 1.15 |
| SAP | SAP | 27.8x | 23.4x | 2.24 |
| Adobe | ADBE | 15.8x | 14.5x | 0.88 |
| ServiceNow | NOW | 54.2x | 59.9x | 1.50 |
| Software Industry Avg | — | 26.4x | 25.9x | — |
Strategic Analysis
- Valuation at Historical LowsSalesforce’s current P/E (TTM) of approximately 25x is significantly lower than its 10-year historical average (which often exceeded 100x). This reflects a market re-rating from a “hyper-growth” stock to a “value-growth” powerhouse.
- The Forward P/E AdvantageBased on FY2026 projections, CRM’s Forward P/E of 14.9x makes it one of the most attractively valued large-cap software companies. It is notably cheaper than Microsoft (25.0x) and SAP (23.4x), and is now trading at levels comparable to Oracle (16.5x), which was historically viewed as the “cheap” incumbent.
- PEG Ratio Signals UndervaluationCRM’s PEG ratio is below 1.0 (approx. 0.90), generally considered a signal that a stock is undervalued relative to its earnings growth. In contrast, SAP’s PEG of 2.24 suggests that investors are paying a much higher premium for each unit of SAP’s earnings growth compared to CRM.
- Shift in Investor SentimentThe lower valuation compared to ServiceNow (54.2x) stems from the deceleration in top-line growth (stabilizing at 9-11%). However, the quality of earnings has improved dramatically, with GAAP operating margins leaping from 2% to over 20%, a factor the market is still in the process of fully pricing in.
Summary:
Relative to its peers, Salesforce appears “relatively inexpensive” on a P/E basis. This offers a compelling entry point for investors prioritizing robust cash flow and margin expansion over pure-play high growth.
Source:
- https://www.wallstreetzen.com/stocks/us/nyse/crm/revenue
- https://cyntexa.com/blog/salesforce-statistics/
- https://investor.salesforce.com/resources/investor-faqs/
- https://www.macrotrends.net/stocks/charts/CRM/salesforce/stock-price-history
Back to Salesforce page