This is a summary of the Reliance Industries Limited (RIL) financial and operational performance for Q3 FY2025-26 (ended December 31, 2025).
Consolidated Financial Highlights
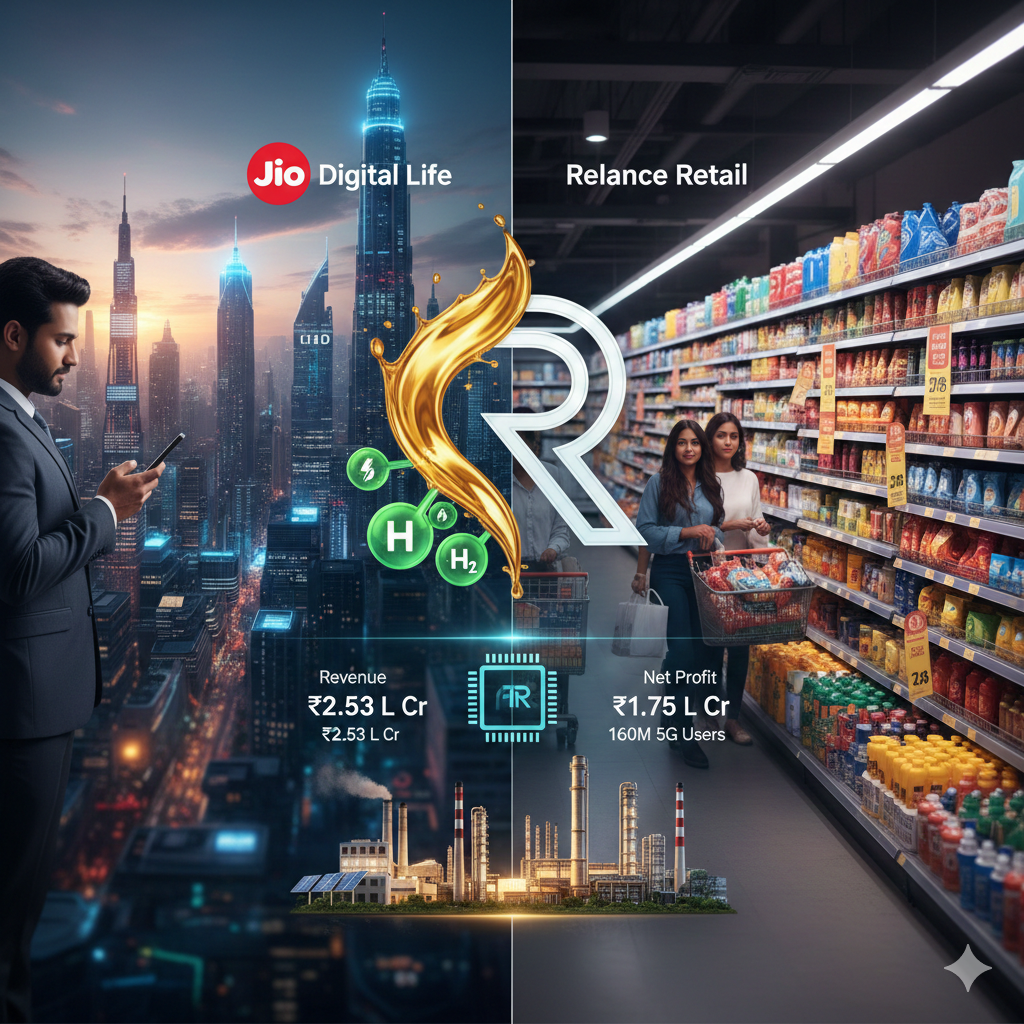
- Total Revenue: ₹2,53,607 crore ($30.3 billion), up 1.9% YoY.
- EBITDA: ₹43,934 crore ($5.2 billion), down 1.6% YoY.
- Net Profit: ₹17,511 crore ($2.1 billion), up 1.4% YoY.
- Capital Expenditure: ₹30,402 crore ($3.6 billion) for the quarter.
Segment Performance
- Jio Platforms (Digital Services)
- Revenue: ₹37,119 crore, up 17.7% YoY.
- EBITDA: ₹15,958 crore, up 14.4% YoY.
- ARPU: Increased to ₹195.1.
- 5G: Over 160 million 5G subscribers, contributing nearly 50% of Jio’s data traffic.
- Reliance Retail
- Revenue: ₹76,572 crore, down 8.4% YoY (impacted by soft demand in Fashion & Lifestyle).
- EBITDA: ₹6,110 crore, up 0.8% YoY.
- Network: 18,960 stores in operation at the end of the quarter.
- Oil to Chemicals (O2C)
- Revenue: ₹1,44,792 crore, up 2.6% YoY.
- EBITDA: ₹12,399 crore, down 11.8% YoY (dragged by lower global fuel margins and planned maintenance shutdowns).
- Oil and Gas (E&P)
- Revenue: ₹6,211 crore, down 6.2% YoY.
- EBITDA: ₹4,910 crore, down 15.4% YoY (impacted by lower gas price ceilings).
Management Commentary
Chairman Mukesh D. Ambani noted that despite a challenging environment for energy margins, the company maintained earnings stability through operational efficiency and volume growth. He highlighted Jio’s strong momentum following tariff revisions and 5G adoption, while the Retail segment focused on improving store productivity.
Here is an explanation of the decline in global fuel margins and its specific impact on the company:
Reasons for the Decline in Global Fuel Margins
- Weakness in Global DemandThe report highlights a significant drop in transportation fuel cracks. This is primarily due to a slowdown in global industrial activity and a cooling of the transportation sector, which has reduced the overall consumption of diesel and gasoline.
- Increased Refining CapacityThe entry of new refining capacities globally, particularly in the Middle East and parts of Asia, has led to an oversupply of refined products. This surplus has put downward pressure on the “crack spreads” (the difference between the price of crude oil and the refined products).
- Significant Drop in Product CracksSpecific data from the report shows that gasoline cracks declined by 24% YoY, while diesel (gasoil) cracks saw a massive 43% YoY decrease. These are the primary drivers of profitability for the O2C (Oil to Chemicals) segment.
- Narrower Brent-Dubai SpreadsThe reduction in the price difference between different crude oil benchmarks (like Brent and Dubai) has also limited the advantage that complex refiners like Reliance typically gain from processing diverse crude grades.
Impact on Reliance Industries (RIL)
- O2C Earnings CompressionThe O2C segment’s EBITDA fell by 11.8% YoY. Even though revenue increased slightly by 2.6% due to higher volumes, the sharp decline in margins meant that the company earned significantly less profit for every barrel processed.
- Overall Group Performance DragBecause the O2C segment is a major contributor to RIL’s total earnings, its decline was the primary reason the group’s consolidated EBITDA saw a 1.6% YoY decrease, despite record performances in the Digital (Jio) and Retail sectors.
- Operational HeadwindsThe margin pressure was compounded by planned maintenance and shutdowns at certain units. This reduced the company’s ability to maximize output during periods when margins might have seen brief recoveries.
- Strategic Pivot AccelerationThe volatility in traditional energy margins reinforces RIL’s strategy to diversify. The company is aggressively scaling its New Energy business (Solar and Hydrogen) and its consumer-facing businesses (Jio and Retail) to reduce its long-term sensitivity to cyclical oil market fluctuations.
Based on online search results and financial data for Reliance Industries Limited (RIL) from FY2021 to FY2025, here is a summary of the past five years’ financial ratio analysis:
Profitability Ratios
- Net Profit Margin: The five-year average stands at approximately 8.78%. It peaked at 11.04% in FY2021 and stabilized around 8.6% by early 2025, despite fluctuations in energy margins and increased interest costs during FY2022-2023.
- Return on Assets (ROA): Showed a strong upward trend, rising from 30.24% in 2021 to a peak of 61.45% in 2023, reflecting improved asset utilization. It slightly moderated to around 53% in 2025 as asset expansion outpaced revenue growth.
- Return on Capital Employed (ROCE): Reached a recent high of 12.98% in FY2024, showing the initial success of diversified investments in Digital Services and Retail.
Solvency and Financial Structure
- Debt-to-Equity Ratio: Maintained at a healthy level between 0.4 and 0.65. It was 0.4 in 2021, rose to 0.63 in 2023 due to heavy Capex, and improved to 0.44 in 2025, reflecting progress in deleveraging and debt optimization.
- Interest Coverage Ratio: Averaged around 5.59x, indicating that operating profits comfortably cover interest payments, providing solid financial flexibility.
Liquidity Ratios
- Current Ratio: Averaged between 1.1x and 1.2x over the last five years. While below the ideal 2:1 ratio, this reflects RIL’s capital-intensive model where cash is prioritized for Capex rather than idle liquid assets.
- Quick Ratio: Has been more volatile, dropping as low as 0.05x in 2023. This indicates that inventory (particularly oil products and retail goods) constitutes a significant portion of its current assets.
Operational Efficiency
- Asset Turnover: Remained stable between 0.5x and 0.6x.
- Sales Growth: Achieved a five-year Compound Annual Growth Rate (CAGR) of approximately 8.95%, driven by aggressive retail store expansion and ARPU growth in Jio.
Summary Analysis
RIL has successfully transitioned from a pure O2C (Oil-to-Chemicals) player to a “Energy + Consumer” conglomerate. Jio and Retail now contribute over 50% of the group’s EBITDA, effectively cushioning the group against the cyclical volatility of global fuel margins.
Based on the latest market data as of February 2026, Reliance Industries Limited (RIL) maintains a unique valuation profile. Because it is a conglomerate spanning energy, retail, and digital services, its P/E ratio is often compared against a basket of diverse competitors.
RIL vs. Competitors: P/E Ratio Comparison (Feb 2026)
The table below compares RIL’s consolidated P/E ratio with key players in its primary business segments.
| Category / Industry | Company Name | TTM P/E Ratio (Feb 2026) | Market Context / Premium |
| Diversified Conglomerate | Reliance Industries (RIL) | 23.1x – 23.7x | Values the “Consumer Ecosystem” premium. |
| Oil & Gas (Energy) | Bharat Petroleum (BPCL) | 6.8x | Traditional energy trades at a deep discount. |
| Indian Oil (IOC) | ~6.8x | Heavily cyclical and regulated pricing. | |
| Chevron (CVX) | 27.6x | International benchmark with stable dividends. | |
| Telecom (Digital) | Bharti Airtel | 33.7x | Pure-play telco with high growth expectations. |
| Retail & E-commerce | Amazon (AMZN) | 27.7x | Comparison for JioMart/Retail growth. |
| Walmart (WMT) | 31.5x | Global retail benchmark. | |
| Market Benchmark | Nifty 50 Index | ~22.6x | RIL trades at a slight premium to the index. |
Key Valuation Insights for 2026
- The “Jio/Retail” Valuation Gap: RIL’s P/E of ~23x is significantly higher than standalone energy peers (IOC/BPCL at ~7x). This indicates that the market prices RIL more as a consumer/technology platform than a refinery. Roughly 50-60% of RIL’s EBITDA now comes from Jio and Retail, which command higher multiples.
- Historical Context: The current P/E of 23.1x is below its 5-year average (which touched 34x in 2024). This “de-rating” in early 2026 is largely due to:
- Fuel Margin Compression: A 43% drop in global diesel cracks has weighed on the O2C segment.
- Retail Slowdown: Weaker discretionary spending in urban India has led to a 11% stock price correction in early 2026.
- SOTP (Sum-of-the-Parts) Potential: Analysts argue that the consolidated P/E masks the true value of individual units. If Reliance Jio or Reliance Retail were to IPO (highly anticipated for late 2026/2027), they would likely command P/E multiples of 35x-45x, similar to Bharti Airtel or global retail giants.
- New Energy Optionality: RIL is currently valued at about 2x its invested capital for its Green Hydrogen and Solar gigafactories. This “New Energy” segment acts as a call option on future growth that is not yet fully reflected in the current P/E.
Technical Position
As of mid-February 2026, the stock has entered an oversold zone (RSI below 25) following the recent correction. Most brokerages (including Goldman Sachs and ICICI Direct) maintain a “Buy” or “Accumulate” rating, viewing the current P/E as a high-margin entry point before the next growth cycle in 5G and New Energy.
Source:
- Finbox – Reliance Industries Current Ratio
- RSIS International – Liquidity Ratios and Profit Projections
- RIL Integrated Annual Report 2024-25
- Trendlyne – Reliance Industries Financial Ratios
- https://www.ril.com/sites/default/files/2026-01/Media_Release_RIL_Q3_FY2025-26_Financial_and_Operational_Performance.pdf
Back to Reliance Industries page