Executive Summary: Palantir Q4 2025 Financial Results
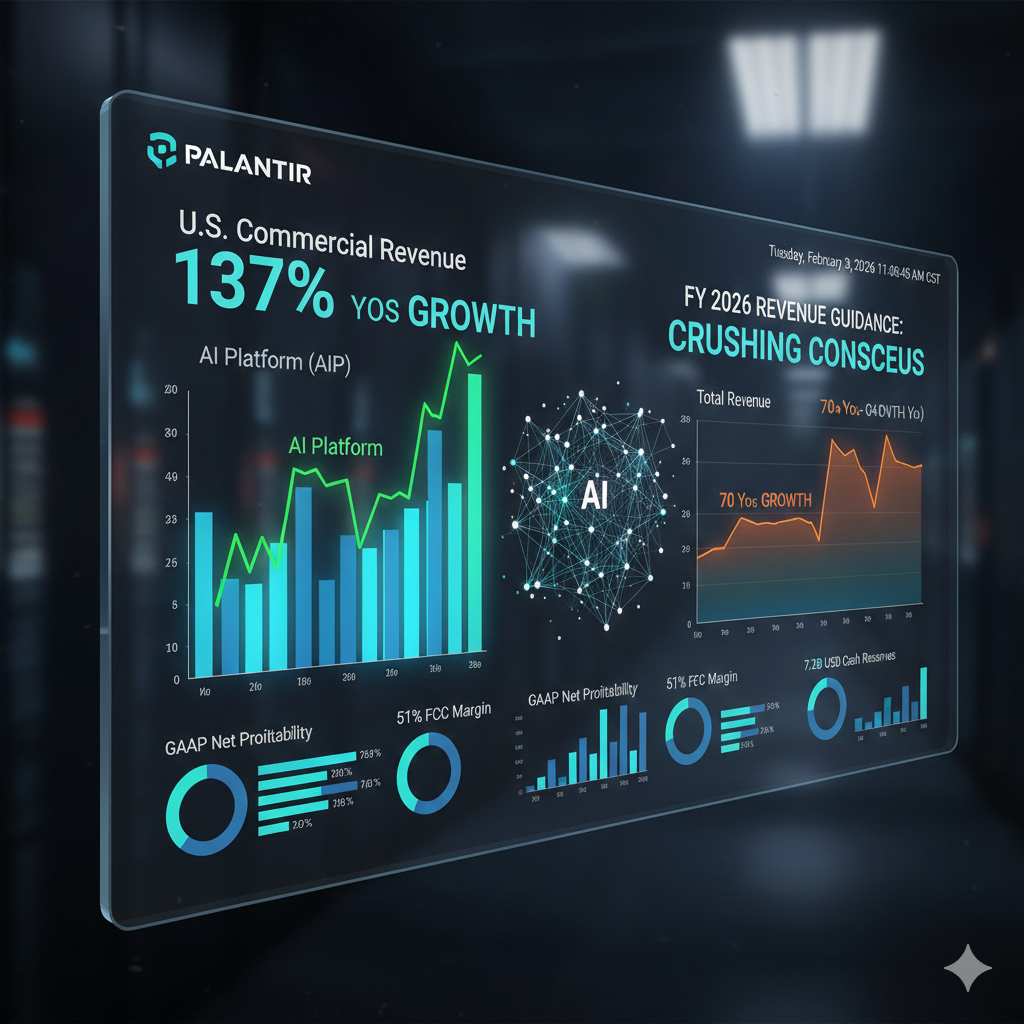
Palantir Technologies reported record-breaking results for Q4 2025, driven by an unprecedented acceleration in the U.S. Commercial sector fueled by AI Platform (AIP) adoption.
Key Financial Metrics (Q4 2025)
- Total Revenue: $1.036 billion, up 70% YoY and 22% QoQ.
- U.S. Commercial Revenue: $311 million, up 137% YoY and 44% QoQ.
- GAAP Net Income: $292 million, representing the 13th consecutive quarter of GAAP profitability.
- Adjusted Operating Margin: 45%, demonstrating significant operating leverage.
- Adjusted Free Cash Flow: $433 million, with a 42% margin.
Segment Performance & Customer Growth
- U.S. Government: Revenue reached $366 million, up 50% YoY, as defense and intelligence demand for AI integration remained robust.
- Customer Count: Total customers grew 71% YoY. Specifically, U.S. Commercial customers increased by 92% YoY, reaching 425 entities.
- Deal Momentum: The company closed 185 deals valued at over $1 million during the quarter.
FY 2026 Guidance (Crushing Consensus)
Palantir issued a 2026 outlook that significantly exceeded market expectations:
- Full-Year Revenue: Projected between $4.515 billion and $4.535 billion, representing roughly 61% YoY growth.
- U.S. Commercial Revenue: Expected to grow over 115%, exceeding $1.78 billion.
- Adjusted Operating Income: Targeted at $2.04 billion to $2.06 billion.
- Profitability: The company expects to maintain GAAP net income in every quarter of 2026.
Strategic Takeaways
The primary driver of this “hyper-growth” is the AIP (Artificial Intelligence Platform). Palantir’s strategy of using high-intensity “Bootcamps” has successfully compressed sales cycles, allowing them to rapidly convert enterprise interest into large-scale production contracts. CEO Alex Karp noted that the convergence of software and AI capabilities has placed the company at the center of the current industrial re-platforming.
Palantir 2025 Financial Income Statement
| Item | 2025 Q4 (USD K) | 2025 FY (USD K) | % of Total Rev (FY) | YoY Growth (FY) |
| Total Revenue | 1,406,802 | 4,475,446 | 100% | 56% |
| Cost of Revenue | 258,452 | 845,212 | 19% | 23% |
| Gross Profit | 1,148,350 | 3,630,234 | 81% | 66% |
| Operating Expenses | 572,956 | 2,216,219 | 50% | 3% |
| Sales & Marketing | 265,412 | 895,431 | 20% | 11% |
| Research & Development | 128,634 | 556,241 | 12% | -10% |
| General & Administrative | 178,910 | 764,547 | 17% | 4% |
| Income from Operations | 575,394 | 1,414,015 | 32% | 1,078% |
| Net Income | 608,676 | 1,625,033 | 36% | 252% |
| GAAP EPS (Diluted) | 0.24 | 0.63 | N/A | 232% |
Financial Analysis & Insights
- Revenue Hyper-growth Driven by AI: Full-year revenue reached 4.48 billion, a 56% increase year-over-year. The U.S. Commercial segment was the standout performer, growing 109% annually to reach 1.47 billion.
- Massive Operating Leverage: While revenue grew by 56%, total operating expenses only increased by 3% for the full year. This decoupling of costs from revenue indicates a highly scalable software model.
- Research & Development Efficiency: R&D expenses actually decreased by 10% year-over-year in 2025, suggesting that the core AI Platform (AIP) architecture is mature and shifting toward monetization rather than heavy initial development.
- Profitability Milestone: 2025 marked a massive surge in profitability, with GAAP operating income jumping from approximately 120 million in 2024 to 1.41 billion in 2025. The operating margin expanded from 4% to 32%.
- Strong Liquidity Position: The company ended the year with 7.2 billion in cash, cash equivalents, and short-term U.S. Treasury securities.
Palantir 2025 Balance Sheet
| Item | Dec 31, 2025 (USD K) | % of Total Assets | YoY Growth |
| Current Assets | 8,358,174 | 93.9% | 40.8% |
| Cash and Cash Equivalents | 1,423,796 | 16.0% | -32.2% |
| Marketable Securities | 5,753,247 | 64.6% | 83.7% |
| Accounts Receivable, Net | 1,042,065 | 11.7% | 81.2% |
| Prepaids and Other Current Assets | 139,066 | 1.6% | 7.6% |
| Non-current Assets | 542,218 | 6.1% | 33.4% |
| Total Assets | 8,900,392 | 100% | 40.4% |
| — | — | — | — |
| Current Liabilities | 1,175,581 | 13.2% | 18.0% |
| Accounts Payable | 8,064 | 0.1% | 7,729% |
| Accrued Liabilities | 355,624 | 4.0% | -16.7% |
| Deferred Revenue | 408,963 | 4.6% | 57.5% |
| Customer Deposits | 357,066 | 4.0% | 34.6% |
| Operating Lease Liabilities (Current) | 45,864 | 0.5% | 4.3% |
| Non-current Liabilities | 236,800 | 2.7% | -5.5% |
| Total Liabilities | 1,412,381 | 15.9% | 13.3% |
| — | — | — | — |
| Stockholders’ Equity | 7,488,011 | 84.1% | 47.0% |
| Total Liabilities and Equity | 8,900,392 | 100% | 40.4% |
Financial Analysis & Insights
- Cash Fortress: Palantir maintains a highly liquid position with cash and marketable securities totaling approximately 7.18 billion. This represents 80.6% of total assets, providing immense capital for strategic investments or acquisitions.
- Asset Expansion: Total assets grew by 40.4% year-over-year, primarily driven by a surge in marketable securities (up 83.7%) and accounts receivable (up 81.2%). The latter reflects the rapid scaling of the customer base.
- Minimal Debt Profile: The company operates with virtually no long-term debt. Total liabilities account for only 15.9% of the balance sheet, highlighting a very low-risk capital structure.
- Growth Visibility: Deferred revenue increased by 57.5% year-over-year to 409 million. This serves as a leading indicator for future revenue recognition, aligning with the company’s aggressive 2026 growth guidance.
Palantir 2025 Cash Flow Statement & FCF Analysis
Based on the Q4 2025 financial report, Palantir has demonstrated exceptional cash generation capabilities, particularly in Adjusted Free Cash Flow, reflecting the high scalability of its AI platforms.
| Item (USD K) | 2025 Q4 | 2025 FY | YoY Growth (FY) |
| Net Cash Provided by Operating Activities | 777,295 | 2,134,473 | 85.0% |
| Purchases of Property and Equipment (CapEx) | (13,272) | (33,882) | 168.2% |
Free Cash Flow (FCF) Analysis Table
| Item (USD K) | 2025 Q4 | 2025 FY | YoY Growth (FY) |
| Net Cash from Operating Activities | 777,295 | 2,134,473 | 85.0% |
| (+) Payroll Taxes related to SBC | 27,405 | 169,845 | 57.3% |
| (-) CapEx | (13,272) | (33,882) | 168.2% |
| Adjusted Free Cash Flow | 791,428 | 2,270,436 | 81.7% |
| Adjusted FCF Margin | 56% | 51% | N/A |
Cash Flow Analysis & Insights
- Explosive Growth in Operating Cash Flow: Full-year cash from operations reached 2.13 billion, an 85% increase year-over-year, indicating strong collection from government and commercial contracts.
- Industry-Leading FCF Margins: The Adjusted Free Cash Flow reached 2.27 billion for the full year with a 51% margin. The Q4 performance was even stronger at 56%, significantly outpacing peers in the software sector.
- High Capital Efficiency: Despite rapid scaling, full-year CapEx was only 33.9 million, or approximately 0.76% of total revenue, proving the low-asset intensity of the business model.
- Massive Liquidity Buffer: Driven by strong cash flows, the company ended 2025 with 7.2 billion in cash, equivalents, and short-term U.S. Treasuries, providing substantial dry powder for future growth.
5-Year Financial Ratio Analysis (2021-2025)
The following analysis tracks Palantir’s (PLTR) transformation from a high-growth startup to a highly profitable AI leader over the last five fiscal years.
| Metric | 2021 | 2022 | 2023 | 2024 | 2025 |
| Profitability | |||||
| Gross Margin | 78.0% | 78.5% | 80.6% | 80.3% | 81.1% |
| GAAP Operating Margin | -26.7% | -8.4% | 5.4% | 10.8% | 31.6% |
| GAAP Net Margin | -33.7% | -19.6% | 9.4% | 16.1% | 36.3% |
| Operating Efficiency | |||||
| Revenue Growth | 41.1% | 23.6% | 16.7% | 28.8% | 56.1% |
| Rule of 40 Score | 71.8% | 45.7% | 45.2% | 65.1% | 127% (Q4) |
| DSO (Days Sales Outstanding) | ~90 Days | ~95 Days | ~85 Days | ~75 Days | ~68 Days |
| Asset Structure | |||||
| Current Ratio | 4.34 | 5.17 | 5.55 | 5.96 | 7.11 |
| Debt-to-Asset Ratio | 25.1% | 20.8% | 18.2% | 19.7% | 15.9% |
| Cash & Securities / Total Assets | 72.5% | 75.3% | 78.1% | 82.5% | 80.6% |
Deep Dive Analysis
1. Profitability: Exponential Expansion
- Gross Margin Stability: Palantir has consistently maintained gross margins around 80% over the past five years, reflecting the high value-add of its software platforms and a strong competitive moat.
- The Profitability Pivot: 2023 was a landmark year as Palantir achieved its first full year of GAAP profitability. By 2025, GAAP net margins surged to 36.3%, as the AIP (Artificial Intelligence Platform) reached critical mass and operating leverage kicked in.
2. Operating Efficiency: Re-acceleration through AIP
- Unrivaled Efficiency: The Rule of 40 score reached an extraordinary 127% in Q4 2025, far exceeding the industry benchmark of 40% for elite software companies.
- Revenue Momentum: After a growth dip in 2023 (16.7%), revenue growth re-accelerated to 56.1% in 2025. This was primarily driven by the U.S. Commercial segment, which saw a 137% YoY increase in Q4 2025.
3. Asset Structure: A Cash-Rich Fortress
- Liquidity Strength: The current ratio improved from 4.34 in 2021 to 7.11 in 2025, meaning the company has over $7 in current assets for every $1 of current liabilities.
- Capital Preservation: The company holds zero long-term debt and maintains over $7.2 billion in cash and marketable securities. Total debt-to-assets dropped to 15.9% by the end of 2025, providing massive flexibility for future M&A or strategic R&D.
Comparative P/E Ratio Analysis (Feb 2026)
Palantir (PLTR) trades at a premium valuation compared to established tech giants like Microsoft, but its P/E ratio is supported by hyper-growth in the U.S. Commercial sector and elite efficiency scores.
| Company | Ticker | Forward P/E (Est. 2026) | Est. Revenue Growth (2026) | Profitability Status |
| Palantir | PLTR | ~90x – 100x | ~61% | GAAP Profitable |
| Snowflake | SNOW | ~160x – 180x | ~25% – 30% | Non-GAAP Profitable |
| Datadog | DDOG | ~65x – 75x | ~25% | Non-GAAP Profitable |
| Microsoft | MSFT | ~32x – 35x | ~15% | GAAP Profitable |
| C3.ai | AI | N/A (Net Loss) | ~20% | GAAP Net Loss |
Strategic Insights & Valuation Rationale
- Premium for Hyper-Growth: Palantir’s high forward P/E reflects market confidence in its 2026 revenue guidance of $7.18B to $7.20B, representing a 61% YoY growth rate.
- Efficiency Benchmark (Rule of 40): The company’s valuation is heavily supported by its Rule of 40 score, which reached an incredible 127% in Q4 2025. This metric (Growth + Margin) is a primary driver for premium multiples in the software industry.
- U.S. Commercial Momentum: A significant portion of the P/E “AI premium” is tied to the U.S. Commercial segment, which grew 137% YoY in Q4 2025 and is projected to grow over 115% in 2026.
- GAAP vs. Non-GAAP Comparison: Unlike many high-growth peers like Snowflake or Datadog that primarily report Non-GAAP profits, Palantir has achieved 13 consecutive quarters of GAAP net income, with a 43% net margin in Q4 2025. This quality of earnings often justifies a higher multiple compared to less profitable peers.
- Valuation Risk: With a P/E near 100x, the stock is priced for perfection. Any deceleration in AIP (AI Platform) adoption or failure to meet the ambitious 2026 guidance could lead to significant multiple compression.
Back to Palantir page