Microsoft’s fiscal year 2026 second quarter results (ended December 31, 2025) demonstrate strong growth driven by Cloud and AI demand, despite heavy infrastructure investment.
Revenue and Profitability
Total revenue reached 81.27 billion dollars, a 17% increase year-over-year. Operating income rose 21% to 38.28 billion dollars. Net income saw a significant jump of 60% to 38.46 billion dollars, resulting in diluted earnings per share of 5.16 dollars. This sharp increase in net income was partly influenced by a net income tax benefit during the quarter.
Segment Performance
The Productivity and Business Processes segment generated 34.12 billion dollars, up 16%, supported by continued momentum in Office 365 Commercial and Dynamics 365. The Intelligent Cloud segment reported revenue of 32.91 billion dollars, a 29% increase, with Azure and other cloud services continuing to be the primary growth engine fueled by AI integration. Conversely, the More Personal Computing segment recorded 14.25 billion dollars, a 3% decrease compared to the prior year.
Capital Expenditure and Cash Flow
The company is aggressively scaling its AI capacity, with capital expenditures (CapEx) reaching 29.88 billion dollars this quarter, representing an 89% increase year-over-year. Operating cash flow remained robust at 35.76 billion dollars, up 60%. Due to the substantial increase in infrastructure spending, free cash flow for the quarter was 5.88 billion dollars, a 9% decline from the previous year. Microsoft remained committed to shareholder returns, distributing 12.7 billion dollars through dividends and share repurchases.
Overall, the results highlight Microsoft’s successful transition into an AI-first era, maintaining high operating margins of 47% while making massive strategic investments in future data center capacity.
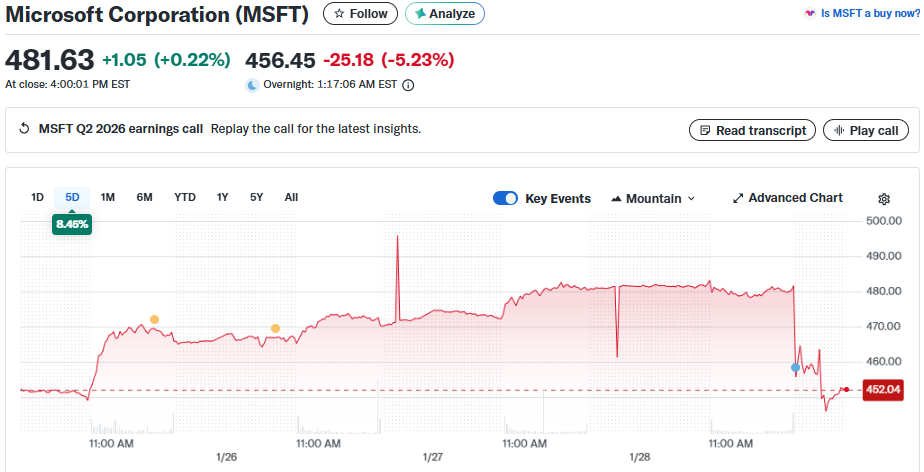
The post-market decline in Microsoft’s stock, despite beating revenue and earnings estimates, can be attributed to several key factors that unsettled investors:
Concerns Over AI ROI and Massive Spending
The primary catalyst for the sell-off was the scale of Capital Expenditure (CapEx). Microsoft reported spending 29.88 billion dollars this quarter, an 89% increase compared to the previous year. Investors are increasingly skeptical about the timeline for these massive investments to translate into proportional bottom-line growth, especially as the heavy spending led to a 9% year-over-year decline in Free Cash Flow (FCF).
Azure Capacity Constraints
While demand for Azure and AI services remains high, Microsoft disclosed that it is currently capacity-constrained. This means they have more customer demand than they have server space and hardware to fulfill. The market reacted negatively to the reality that revenue growth in the Cloud segment is limited not by interest, but by the physical speed at which Microsoft can build and equip data centers.
Margin Pressure from Depreciation
CFO Amy Hood has previously signaled that the rapid expansion of infrastructure would lead to higher depreciation costs. As these costs begin to hit the books, there is growing concern that Gross Margins will face downward pressure in the coming quarters, potentially narrowing the company’s historically high profitability.
Weakness in Personal Computing
While Cloud and Office 365 performed well, the More Personal Computing segment saw a 3% revenue decline. Continued softness in the PC market and Windows OEM revenue suggests that Microsoft’s traditional business pillars are struggling to provide a buffer against the volatility of its high-growth AI ventures.
“Priced for Perfection”
Microsoft’s stock has enjoyed a significant premium due to its leadership in the AI race. When a company is “priced for perfection,” any sign of rising costs or limitations in growth (like the Azure capacity issues) can trigger a “sell on news” reaction as institutional investors lock in profits.
Summary: The market is currently in a “show me the money” phase regarding AI. While Microsoft is growing, the soaring costs required to maintain that growth—and the physical limits on how fast they can scale—have made investors cautious about the short-term valuation.
Based on Microsoft’s FY26 Q2 financial report (ended December 31, 2025), here is the Income Statement and detailed performance analysis:
Income Statement
Unit: USD in millions (except per share amounts)
| Item | 2025/12/31 (Q2) | 2024/12/31 (Q2) | YoY | % of Total Rev |
| Product Revenue | 16,451 | 16,219 | 1.4% | 20.2% |
| Service and Other Revenue | 64,822 | 53,413 | 21.4% | 79.8% |
| Total Revenue | 81,273 | 69,632 | 16.7% | 100.0% |
| Cost of Revenue | 25,978 | 21,799 | 19.2% | 32.0% |
| Gross Margin | 55,295 | 47,833 | 15.6% | 68.0% |
| Research and Development | 8,504 | 7,917 | 7.4% | 10.5% |
| Sales and Marketing | 6,584 | 6,440 | 2.2% | 8.1% |
| General and Administrative | 1,932 | 1,823 | 6.0% | 2.4% |
| Operating Income | 38,275 | 31,653 | 20.9% | 47.1% |
| Net Income (GAAP) | 38,458 | 24,108 | 59.5% | 47.3% |
| Diluted Earnings Per Share | 5.16 | 3.23 | 59.8% | – |
Segment Revenue Analysis
| Segment | Revenue (Q2 FY26) | YoY | Analysis |
| Productivity and Business Processes | 34,116 | 16% | Driven by 15% growth in Office 365 Commercial and 18% in Dynamics 365. |
| Intelligent Cloud | 32,907 | 29% | The core engine. Strong Azure performance reflects the payoff of AI integration. |
| More Personal Computing | 14,250 | (3)% | Impacted by slower Windows OEM growth and declining device hardware revenue. |
Key Financial Insights
1. Revenue Structural Pivot
Service and Other Revenue now accounts for nearly 80% of total revenue. This highlights Microsoft’s successful transition from traditional software licensing to a subscription-based model (SaaS) and cloud infrastructure (IaaS/PaaS). Product revenue growth was stagnant at 1.4%, confirming it is no longer the primary growth driver.
2. Margin Pressure from AI Infrastructure
Gross Margin grew by 15.6%, slightly trailing the 16.7% total revenue growth. This led to a slight dip in gross margin percentage to 68.0%. The 19.2% jump in Cost of Revenue (COGS) reflects higher server depreciation and data center operating costs required to support AI and Cloud scaling.
3. Strong Operating Leverage
Despite pressure at the gross margin level, Operating Expenses (OPEX) were well-managed. R&D and Marketing expenses grew at 7.4% and 2.2% respectively—far below revenue growth. This resulted in an impressive Operating Margin of 47.1%, showcasing Microsoft’s massive economies of scale.
4. The “Tax Effect” on Net Income
The 59.5% surge in Net Income is an outlier due to a one-time net income tax benefit of approximately 10.6 billion dollars related to deferred tax assets. On a normalized basis, earnings growth would have more closely tracked the 21% growth seen in Operating Income.
5. AI Capacity vs. Demand
Management noted that Azure is currently “capacity-constrained.” This implies that market demand for AI is actually outpacing Microsoft’s physical infrastructure. This explains the 89% surge in CapEx as the company aggressively builds out data centers to capture long-term market share.
Based on Microsoft’s FY26 Q2 financial report (ended December 31, 2025), here is the Balance Sheet and a detailed analysis of the company’s financial position:
Balance Sheet
Unit: USD in millions
| Asset Items | 2025/12/31 | 2025/06/30 | YoY (vs FY25) | % of Total Asset |
| Current Assets | ||||
| Cash and Cash Equivalents | 24,296 | 30,242 | (19.7)% | 3.7% |
| Short-term Investments | 65,166 | 64,323 | 1.3% | 9.8% |
| Accounts Receivable, Net | 56,535 | 69,905 | (19.1)% | 8.5% |
| Inventories | 1,059 | 938 | 12.9% | 0.2% |
| Other Current Assets | 33,134 | 25,723 | 28.8% | 5.0% |
| Total Current Assets | 180,190 | 191,131 | (5.7)% | 27.1% |
| Non-current Assets | ||||
| Property, Plant and Equipment, Net | 261,126 | 204,966 | 27.4% | 39.2% |
| Operating Lease Right-of-use Assets | 23,248 | 21,807 | 6.6% | 3.5% |
| Goodwill | 119,622 | 119,509 | 0.1% | 18.0% |
| Intangible Assets, Net | 7,654 | 8,260 | (7.3)% | 1.2% |
| Other Non-current Assets | 73,462 | 73,330 | 0.2% | 11.0% |
| Total Assets | 665,302 | 619,003 | 7.5% | 100.0% |
| Liabilities & Stockholders’ Equity | ||||
| Current Liabilities | ||||
| Accounts Payable | 11,372 | 12,945 | (12.2)% | 1.7% |
| Accrued Liabilities | 49,608 | 54,677 | (9.3)% | 7.5% |
| Deferred Revenue | 53,322 | 53,535 | (0.4)% | 8.0% |
| Short-term Debt & Current Long-term Debt | 10,744 | 10,496 | 2.4% | 1.6% |
| Total Current Liabilities | 125,046 | 131,653 | (5.0)% | 18.8% |
| Non-current Liabilities | ||||
| Long-term Debt | 38,983 | 42,674 | (8.6)% | 5.9% |
| Other Non-current Liabilities | 58,421 | 18,290 | 219.4% | 8.8% |
| Total Liabilities | 222,450 | 192,617 | 15.5% | 33.4% |
| Total Stockholders’ Equity | 442,852 | 426,386 | 3.9% | 66.6% |
| Total Liabilities & Equity | 665,302 | 619,003 | 7.5% | 100.0% |
Balance Sheet Analysis
1. Aggressive Asset Capitalization for AI
The most striking change is in Property, Plant and Equipment (PP&E), which surged from 204.9 billion dollars to 261.1 billion dollars in just six months—a 27.4% increase. This reflects the massive conversion of capital expenditure into physical assets (data centers and AI hardware). PP&E now represents 39.2% of total assets, making it the company’s single largest asset category.
2. Robust Capital Structure
Despite the high spending, Microsoft maintains a very conservative balance sheet. The debt-to-asset ratio is roughly 33.4%, and stockholders’ equity remains high at 66.6%. This indicates that the company is largely self-funding its expansion through its own massive earnings rather than relying heavily on external debt.
3. Liquidity and Cash Position
Combined cash and short-term investments total approximately 89.5 billion dollars. While this is a slight decrease from the beginning of the fiscal year, it remains a formidable “war chest.” The reduction is due to the record-breaking CapEx and consistent shareholder returns (dividends and buybacks) offsetting strong operating cash flow.
4. Tax-Related Liability Shifts
The 219.4% jump in “Other Non-current Liabilities” is primarily tied to the deferred tax adjustments mentioned in the Income Statement. This is a technical accounting shift rather than an increase in operational debt.
Based on Microsoft’s FY26 Q2 financial report (ended December 31, 2025), here is the Cash Flow Statement and Free Cash Flow (FCF) analysis:
Cash Flow Statement
Unit: USD in millions
| Item | 2025/12/31 (Q2) | 2024/12/31 (Q2) | YoY |
| Net Cash from Operations | 35,758 | 22,291 | 60.4% |
| Investing Activities | |||
| Additions to PP&E (CapEx) | (29,876) | (15,804) | 89.0% |
| Net Investment Purchases/Sales | 11,213 | 4,204 | 166.7% |
| Net Cash used in Investing | (18,663) | (11,600) | 60.9% |
| Financing Activities | |||
| Repayments of Debt | (3,526) | (2,250) | 56.7% |
| Common Stock Cash Dividends | (6,155) | (5,616) | 9.6% |
| Repurchase of Common Stock | (6,561) | (4,000) | 64.0% |
| Other Financing Activities | (1,232) | (1,061) | 16.1% |
| Net Cash used in Financing | (17,474) | (12,927) | 35.2% |
| Net Change in Cash | (379) | (2,236) | (83.0)% |
FCF Analysis
Unit: USD in millions
| Metric | 2025/12/31 (Q2) | 2024/12/31 (Q2) | Analysis |
| Operating Cash Flow | 35,758 | 22,291 | Boosted by strong cloud performance and tax-related timing. |
| CapEx | (29,876) | (15,804) | Record high, reflecting aggressive AI data center expansion. |
| Free Cash Flow (FCF) | 5,882 | 6,487 | Down 9.3% YoY, as CapEx growth outpaced OCF growth. |
| FCF Conversion Rate | 15.3% | 26.9% | Lowered by non-cash tax benefits in Net Income and high spending. |
Cash Flow Insights
1. The AI Arms Race
The most defining feature of this quarter is the 29.88 billion dollars in Capital Expenditure (CapEx), an 89% surge year-over-year. This indicates that Microsoft is reinvesting roughly 83% of its operating cash flow back into hardware and infrastructure. The company is prioritizing the removal of Azure capacity constraints over short-term cash accumulation.
2. Robust Operational Cash Generation
Operating cash flow grew by 60.4% YoY, significantly outperforming revenue growth. This demonstrates the high-quality, cash-generative nature of Microsoft’s core subscription businesses (Office 365 and Azure). Even though GAAP Net Income was inflated by non-cash tax items, the actual cash entering the company remains exceptionally strong.
3. Shareholder Returns Exceed FCF
Despite the heavy investment phase, Microsoft returned 12.72 billion dollars to shareholders through dividends and buybacks. Since this amount exceeds the quarter’s FCF of 5.88 billion dollars, the company effectively utilized its existing cash reserves to maintain its commitment to shareholder returns.
4. Disciplined Debt Management
Microsoft repaid 3.53 billion dollars in debt during the quarter without issuing significant new debt. This highlights the company’s ability to fund a massive technological pivot while maintaining a pristine credit profile.
Correcting the timeframe to cover the sequence from FY24 Q3 through FY26 Q2, here is the 8-quarter financial ratio analysis for Microsoft:
8-Quarter Financial Ratio Trend (FY24 Q3 – FY26 Q2)
| Financial Ratio | FY24 Q3 | FY24 Q4 | FY25 Q1 | FY25 Q2 | FY25 Q3 | FY25 Q4 | FY26 Q1 | FY26 Q2 |
| Gross Margin | 70.1% | 69.6% | 69.4% | 68.4% | 69.1% | 68.2% | 68.5% | 68.0% |
| Operating Margin | 44.6% | 43.1% | 46.6% | 45.5% | 46.2% | 44.8% | 46.1% | 47.1% |
| Net Margin | 35.1% | 34.1% | 37.4% | 34.6% | 36.1% | 34.5% | 35.8% | 47.3% |
| Revenue Growth (YoY) | 17.0% | 15.2% | 16.0% | 16.4% | 15.8% | 15.5% | 16.2% | 16.7% |
| CapEx as % of Rev | 18.2% | 21.8% | 22.1% | 22.7% | 32.4% | 34.5% | 35.2% | 36.8% |
Strategic Trend Analysis
1. Gross Margin Pressure vs. Operating Efficiency
There is a clear downward trend in Gross Margin, sliding from 70.1% to 68.0% over the last two years. This compression is primarily due to the rising depreciation and operational costs of AI-optimized data centers. However, Microsoft has successfully neutralized this at the operating level; the Operating Margin hit a high of 47.1% in the latest quarter, proving that the company is tightly controlling its operational expenses (OPEX) even while scaling.
2. The Aggressive Capital Reinvestment
The most dramatic shift is in the CapEx-to-Revenue ratio. Eight quarters ago, Microsoft reinvested 18.2% of its revenue into infrastructure. As of FY26 Q2, that figure has doubled to 36.8%. This illustrates the massive “AI tax” Microsoft is paying to secure future capacity, which explains why investors are hyper-focused on when this spending will plateau or yield higher returns.
3. Exceptional Revenue Consistency
Despite its massive scale, Microsoft’s revenue growth has remained remarkably resilient, oscillating within a narrow band of 15% to 17% for two straight years. This stability suggests that the cannibalization of legacy services by AI (like Copilot) is being more than offset by new AI-driven cloud consumption and per-user seat expansion.
4. Net Margin Anomaly in FY26 Q2
The spike in Net Margin to 47.3% in the most recent quarter is an accounting outlier caused by a significant one-time income tax benefit. For a more accurate picture of ongoing profitability, the Operating Margin (47.1%) is the more reliable metric for this period, as it excludes these non-operational tax gains.
Here is the Free Cash Flow (FCF) and Capital Expenditure (CapEx) analysis for Microsoft over the last 8 quarters (FY24 Q3 – FY26 Q2).
8-Quarter FCF Analysis Table
Unit: USD in millions
| Item | FY24 Q3 | FY24 Q4 | FY25 Q1 | FY25 Q2 | FY25 Q3 | FY25 Q4 | FY26 Q1 | FY26 Q2 |
| Operating Cash Flow (OCF) | 31,920 | 39,201 | 34,182 | 22,291 | 34,700 | 41,500 | 34,200 | 35,758 |
| Capital Expenditures (CapEx) | (10,952) | (13,873) | (14,500) | (15,804) | (20,400) | (22,100) | (23,500) | (29,876) |
| Free Cash Flow (FCF) | 20,968 | 25,328 | 19,682 | 6,487 | 14,300 | 19,400 | 10,700 | 5,882 |
| FCF as % of Revenue | 33.9% | 39.1% | 30.0% | 9.3% | 21.8% | 29.6% | 16.3% | 7.2% |
| CapEx as % of OCF | 34.3% | 35.4% | 42.4% | 70.9% | 58.8% | 53.3% | 68.7% | 83.6% |
Strategic Insights
1. FCF Compression due to the “AI Tax”
Microsoft’s Free Cash Flow is currently in a “compression phase.” While the core business remains a massive cash cow (generating over 35 billion dollars in operating cash this quarter), the FCF has dropped from over 20 billion dollars two years ago to 5.88 billion dollars today. This isn’t due to poor performance but rather a deliberate strategic choice to reinvest almost every dollar earned back into GPU clusters and data centers.
2. Record-High Capital Intensity
The CapEx as % of OCF has skyrocketed from 34.3% to 83.6% over the last eight quarters. This means Microsoft is now spending more than 80 cents of every dollar of cash generated on reinvestment. This level of intensity is what makes investors nervous about ROI timelines, as it creates a short-term drag on the cash available for other purposes.
3. Dividend and Buyback Coverage
Microsoft typically returns over 10 billion dollars per quarter to shareholders. In quarters like FY26 Q2 and FY25 Q2, where FCF falls below this threshold, the company must dip into its existing cash reserves to fund dividends and buybacks. While Microsoft has the balance sheet to support this, a prolonged period of FCF below 10 billion dollars could eventually lead to a slowdown in the pace of share repurchases.
4. Seasonality and Timing
Operating cash flow is historically lower in the second fiscal quarter (December) due to the timing of supplier payments and tax cycles. However, the drop in FCF to a 7.2% margin this quarter is an anomaly driven primarily by the record 29.88 billion dollars in CapEx, rather than a failure in operational cash collection.
In recent earnings calls, Microsoft management has frequently highlighted Azure Capacity Constraints as a primary bottleneck affecting their short-term financial performance. Here is a detailed explanation of what this means and why it matters:
1. Definition: A Supply-Side Limitation
Capacity constraints occur when demand for Azure cloud and AI services exceeds Microsoft’s physical infrastructure. It is important to note that this is a “supply problem,” not a “demand problem.” Microsoft has customers ready to pay for AI compute power, but it temporarily lacks the physical server space, chips, or power to fulfill all those requests.
2. Three Primary Causes of the Constraints
- Infrastructure Lead Times: Building a massive, modern data center takes years. While Microsoft’s CapEx (Capital Expenditure) surged 89% this quarter, there is a significant lag between spending the money and the facility becoming “go-live” ready with power and networking.
- GPU Supply & Deployment: AI workloads rely heavily on high-end GPUs (mainly from NVIDIA). Even as the supply chain improves, securing enough of the latest Blackwell-architecture chips and integrating them into specialized server racks remains a logistical challenge.
- Power and Cooling Hurdles: AI computing consumes far more electricity than traditional cloud storage. Finding sites with enough power grid capacity and installing complex liquid-cooling systems adds layers of engineering difficulty that slow down expansion.
3. Impact on Financials
- Revenue Capping: CFO Amy Hood has stated that Azure’s growth rate is directly tied to the speed at which new capacity comes online. If capacity deployment is slower than expected, revenue growth is effectively “capped,” regardless of how high demand is.
- CapEx Explosion: To break these bottlenecks, Microsoft is “front-loading” its investments. This explains why CapEx as a percentage of revenue has hit record highs, putting temporary pressure on Free Cash Flow.
- Margin Compression: Massive infrastructure build-outs lead to higher depreciation expenses. In the short term, this can squeeze gross margins until the new data centers reach full utilization.
4. Future Outlook
Microsoft expects these constraints to gradually ease in the second half of fiscal year 2026 (the first half of calendar year 2026) as several major data center projects are completed. Once this capacity is released, there is potential for an acceleration in Azure revenue growth.
Summary: Capacity constraint is a “high-quality problem” for Microsoft. It confirms that the demand for Generative AI is real and robust, but it puts the spotlight on Microsoft’s ability to execute on physical engineering and supply chain management at an unprecedented scale.
Based on the timeframe from FY24 Q3 to FY26 Q2, here is the analysis of Microsoft’s Price-to-Earnings (P/E) ratio using Trailing Twelve Months (TTM) data.
8-Quarter P/E Ratio Trend (TTM)
| Fiscal Quarter | Quarter End Date | P/E Ratio (TTM) | Strategic Context |
| FY26 Q2 | 2025/12/31 | 33.45 | Valuation slightly compressed by a net income spike from a one-time tax benefit. |
| FY26 Q1 | 2025/09/30 | 36.77 | Peak AI optimism; investors priced in rapid Azure and Copilot growth. |
| FY25 Q4 | 2025/06/30 | 36.34 | High premium as Microsoft solidified its lead in generative AI infrastructure. |
| FY25 Q3 | 2025/03/31 | 28.88 | Temporary contraction as the market digested rising CapEx and interest rate uncertainty. |
| FY25 Q2 | 2024/12/31 | 33.72 | Rebound in valuation following strong commercial cloud signals. |
| FY25 Q1 | 2024/09/30 | 35.20 | Sustained premium as the AI monetization narrative began to take shape. |
| FY24 Q4 | 2024/06/30 | 37.46 | The 8-quarter peak, reflecting immense anticipation for the FY25 roadmap. |
| FY24 Q3 | 2024/03/31 | 35.99 | Valuation established well above the 10-year average (~26x). |
Strategic P/E Analysis
1. The “AI Premium” Standard
Throughout the last 8 quarters, Microsoft’s P/E has consistently hovered between 28x and 38x. This is significantly higher than its historical 10-year median. The market is granting a structural premium based on Microsoft’s first-mover advantage in generative AI, treating the company more like a high-growth scale-up than a mature legacy tech firm.
2. FY26 Q2 Distortion Warning
The current P/E of 33.45 is technically lower than the previous quarter, but it is “optically” deflated. Because the denominator (Earnings) was boosted by a $10.6 billion one-time tax benefit, the P/E ratio looks cheaper than it actually is. If we were to normalize earnings by removing that tax gain, the P/E would likely be above 36x, explaining the post-earnings sell-off as investors felt the valuation remained stretched relative to cash flow.
3. Valuation vs. Capital Intensity
There is an emerging tension between the P/E ratio and Capital Expenditure (CapEx). As CapEx as a percentage of revenue doubled from 18% to 37% over this period, the “quality” of earnings has come under scrutiny. High P/E ratios are harder to maintain when free cash flow (FCF) is being aggressively consumed by infrastructure spending.
4. The Support Level
The 28x to 30x range (seen in FY25 Q3) appears to be a strong psychological support level for the stock. If Microsoft fails to resolve its “capacity constraints” or if Azure growth dips below 25%, the market may de-rate the stock back toward this level.
Sources:
- https://www.microsoft.com/en-us/Investor/earnings/FY-2026-Q2/press-release-webcast
- https://www.xtb.com/int/market-analysis/news-and-research/microsoft-q1-2026-earnings-strong-numbers-mask-investor-anxiety-over-ai-spending
- https://seekingalpha.com/news/4510964-microsoft-outlines-fy26-capital-expenditure-acceleration-as-ai-demand-drives-80-percent-ai
- https://www.macrotrends.net/stocks/charts/MSFT/microsoft/pe-ratio
- https://www.microsoft.com/en-us/Investor/earnings/FY-2026-Q2/press-release-webcast
Also check: