Meta’s Fourth Quarter and Full Year 2025 financial results are summarized below:
Operational Performance
Meta delivered robust revenue growth in the fourth quarter of 2025, with revenue reaching $59,893 million, a 24% increase year-over-year. For the full year 2025, total revenue surpassed the $200 billion milestone, totaling $200,966 million, up 22% from the previous year. This growth was primarily fueled by the advertising business, which contributed $58,137 million in the fourth quarter, representing approximately 97% of total revenue.
Profitability
Income from operations for the fourth quarter was $24,745 million, up 6% year-over-year, maintaining a strong operating margin of 41%. While full-year net income saw a slight decline of 3% to $60,458 million due to tax adjustments and spending structures, diluted earnings per share (EPS) for the fourth quarter rose 11% to $8.88.
Segment Analysis
The Family of Apps (FoA) segment, encompassing Facebook, Instagram, Messenger, and WhatsApp, remains the core profit engine, with fourth-quarter revenue growing 25% year-over-year. In contrast, Reality Labs (RL), the division focused on the metaverse and virtual reality, showed weakness with a 12% revenue decline to $955 million in the fourth quarter. Reality Labs continues to operate at a significant loss, recording a full-year operating loss of $21.45 billion.
Cash Flow and Investments
The company is in a period of intense infrastructure investment, with full-year 2025 capital expenditures (CapEx) surging 84% to $72,215 million, driven by AI-related initiatives. Despite these massive investments, Meta demonstrated exceptional cash generation capabilities, with net cash from operating activities reaching $115,800 million for the year, up 27%. Full-year free cash flow (FCF) stood at $43,585 million.
Financial Position
As of December 31, 2025, Meta held $81,592 million in cash, cash equivalents, and marketable securities. Long-term debt increased significantly to $58,744 million, more than doubling from the previous year to support the company’s financing needs.
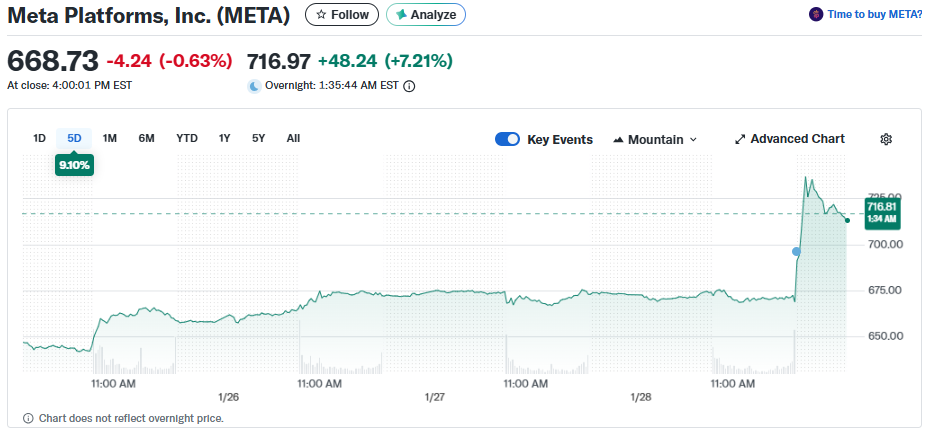
Meta’s stock surged more than 11% in after-hours trading on January 28, 2026, pushing the price past $740. This rally was driven by investor optimism regarding Meta’s “monetization efficiency” and a “clear path to AI profitability.”
The key drivers for the post-earnings surge are analyzed below:
1. Financial Performance Exceeded Expectations
- Top and Bottom Line Beat: Revenue reached $59,893M (up 24% YoY), exceeding the market estimate of $58.5B. Diluted EPS was $8.88 (up 11% YoY), significantly beating the expected $8.21.
- Strong Ad Engine: Ad impressions grew by 18%, and the average price per ad increased by 6%. This demonstrates that AI-driven recommendation algorithms (for Reels) and automated ad tools (Advantage+) are successfully boosting conversion and efficiency.
2. Explosive Q1 2026 Revenue Guidance
- Robust Outlook: Meta projected Q1 2026 revenue to be between $53,500M and $56,500M, far exceeding the analyst consensus of $51.4B.
- Sustained High Growth: The midpoint of this guidance represents approximately 30% YoY growth. For a company of Meta’s scale, this growth rate is exceptional and alleviated concerns about a potential slowdown.
3. “Justifying” AI Spending and Profitability Promises
- Clear Spending Roadmap: Unlike the previous quarter’s vague warnings of “significant increases,” Meta explicitly guided 2026 CapEx to be between $115,000M and $135,000M.
- Commitment to Growth: Management committed that full-year 2026 operating income will be higher than in 2025. This sent a strong signal to investors that AI investments are a strategic roadmap to higher profits, not just a black hole of spending.
4. Sharp Contrast with Peers
- AI Leadership Status: On the same day, Microsoft’s stock fell over 7% after-hours due to slowing cloud growth and high capital costs. In contrast, Meta demonstrated how AI is directly fueling its core advertising business. This contrast reinforced the view that Meta is currently the most successful “AI-monetizer” among Big Tech.
Summary of Market Sentiment Shift
Investors moved from fearing the “Cost of AI” to cheering the “Returns of AI.” By providing both a massive revenue beat and higher-than-expected guidance, Meta proved that its heavy infrastructure investment is already translating into top-tier revenue growth.
Meta’s 2025Q4 and 2025FY income statement
Unit: USD Million (except EPS and percentages)
| Item | 2025Q4 | % ot total rev | yoy | 2025FY | % ot total rev | yoy |
| Revenue | 59,893 | 100.0% | 24% | 200,966 | 100.0% | 22% |
| – Advertising | 58,137 | 97.1% | 24% | 196,175 | 97.6% | 22% |
| – Other revenue | 801 | 1.3% | 54% | 2,584 | 1.3% | 50% |
| – Reality Labs | 955 | 1.6% | (12%) | 2,207 | 1.1% | 3% |
| Total costs and expenses | 35,148 | 58.7% | 40% | 117,690 | 58.6% | 24% |
| Income from operations | 24,745 | 41.3% | 6% | 83,276 | 41.4% | 20% |
| Net income | 22,768 | 38.0% | 9% | 60,458 | 30.1% | (3%) |
| Diluted EPS | 8.88 | – | 11% | 23.49 | – | (2%) |
segment rev
| Segment | 2025Q4 | yoy | 2025FY | yoy |
| Family of Apps (FoA) | 58,938 | 25% | 198,759 | 22% |
| Reality Labs (RL) | 955 | (12%) | 2,207 | 3% |
| Total Segment Revenue | 59,893 | 24% | 200,966 | 22% |
Financial Analysis
- Advertising Remains the Core Growth EngineMeta demonstrated strong earnings resilience in 2025Q4, with revenue increasing 24%. This was primarily driven by an increase in ad impressions and higher average prices per ad. The FoA segment (Facebook, Instagram, WhatsApp, etc.) saw 25% growth, indicating that user engagement and monetization efficiency on core social platforms remain at high levels.
- Expansion of Costs and ExpensesTotal costs and expenses grew by 40% in Q4, significantly outpacing revenue growth. This reflects massive investments in AI infrastructure, including higher server depreciation, R&D headcount costs, and hardware expenditures to support AI training. While the full-year operating margin remained robust at 41%, cost pressures have begun to manifest in the financial statements.
- Reality Labs Stagnation and Loss PressuresReality Labs (RL) experienced a 12% revenue decline in Q4, reaching only 955 million. Despite a slight 3% increase for the full year, the segment’s operating losses remain substantial. Due to challenges in hardware product cycles and market adoption, RL is expected to remain a significant financial burden in the short term, relying on FoA’s advertising profits for support.
- Net Income and EPS PerformanceQ4 net income grew by 9%, largely driven by robust top-line growth. However, full-year net income declined slightly by 3%. This was partly due to a higher base in 2024 from one-time tax benefits and the significant jump in R&D and infrastructure investment in 2025, leading to a 2% minor decline in full-year EPS.
Meta’s FY2025 balance sheet
Unit: USD Million
| Item | 2025/12/31 | % of total asset | yoy |
| Cash and cash equivalents | 35,873 | 9.8% | (18%) |
| Marketable securities | 45,719 | 12.5% | 35% |
| Property and equipment, net | 176,400 | 48.2% | 45% |
| Other assets | 108,029 | 29.5% | 44% |
| Total assets | 366,021 | 100.0% | 33% |
| Total current liabilities | 31,219 | 8.5% | 14% |
| Long-term debt | 58,744 | 16.0% | 104% |
| Other liabilities | 58,815 | 16.1% | 61% |
| Total liabilities | 148,778 | 40.6% | 59% |
| Total stockholders’ equity | 217,243 | 59.4% | 19% |
Balance Sheet Analysis
- Capital Expenditures Reflected in Asset StructureProperty and equipment (net) surged by 45% to $176.4 billion, accounting for nearly half (48.2%) of total assets. This directly corresponds to Meta’s massive capital investment in AI infrastructure and data centers throughout 2025, signaling the company’s aggressive pivot toward converting cash into long-term competitive infrastructure.
- Significant Increase in Debt ScaleLong-term debt increased from approximately $28.7 billion at the end of 2024 to $58.74 billion, a growth of 104%. This indicates that while Meta utilizes cash from operations for its AI and Metaverse development, it is also actively leveraging debt financing to maintain its high-speed investment cadence. The total liabilities-to-assets ratio rose from 34% in the previous year to 40.6%.
- Robust Liquidity with a Shift in CompositionWhile cash and cash equivalents decreased by 18%, marketable securities grew by 35%. Combined, the total cash reserve stands at approximately $81.6 billion. Although slightly lower than the previous year, it remains more than sufficient for short-term operations and debt obligations, demonstrating continued high financial flexibility.
- Steady Growth in EquityDespite the expansion of the balance sheet driven by increased debt, stockholders’ equity still grew by 19% to reach $217.2 billion. This reflects that even amidst heavy capital investment and minor profit fluctuations, the core FoA (Family of Apps) business continues to generate enough profit to strengthen the company’s net asset base.
Meta’s cash flow statement
Unit: USD Million
| Item | 2025Q4 | yoy | 2025FY | yoy |
| Net cash from operating activities | 36,214 | 29% | 115,800 | 27% |
| Capital expenditures (CapEx) | (22,137) | 49% | (72,215) | 84% |
| Free Cash Flow (FCF) | 14,077 | 7% | 43,585 | (16%) |
FCF Analysis
| Period | Operating Cash Flow | Capital Expenditures | Free Cash Flow | FCF Margin |
| 2025Q4 | 36,214 | (22,137) | 14,077 | 23.5% |
| 2024Q4 | 27,988 | (14,836) | 13,152 | 27.2% |
| 2025FY | 115,800 | (72,215) | 43,585 | 21.7% |
| 2024FY | 91,328 | (39,225) | 52,103 | 31.6% |
Cash Flow Analysis
- Strong Growth in Operating Cash FlowMeta demonstrated powerful core earning capacity in 2025, with full-year net cash from operating activities reaching $115,800 million, a 27% increase year-over-year. This was primarily driven by robust advertising revenue growth and improved monetization efficiency within the Family of Apps segment, providing the company with ample internal funding.
- Massive Expansion of Capital ExpendituresTo maintain its competitive edge in the AI sector, Meta significantly ramped up infrastructure investments in 2025. Full-year capital expenditures reached $72,215 million, an 84% increase. This reflects the company’s aggressive strategy in acquiring computing resources and expanding AI-specialized data centers.
- Free Cash Flow Squeezed by InvestmentsWhile operating cash flow grew, the growth rate of capital expenditures far outpaced it, leading to a 16% decline in full-year free cash flow to $43,585 million. The FCF margin dropped from 31.6% in 2024 to 21.7% in 2025, highlighting that the company is currently in a high-intensity investment cycle, trading immediate cash for future AI capabilities.
- Shareholder Returns and Cash ManagementDespite the enormous capital outlay, Meta continued to return value to shareholders through share repurchases and dividends. By the end of 2025, the company maintained approximately $81,592 million in cash and marketable securities, indicating a healthy financial position capable of supporting ongoing R&D and operational scaling.
Meta Five-Year Financial Ratio Analysis (2021-2025)
| Category | Item | 2021 | 2022 | 2023 | 2024 | 2025 |
| Profitability | Operating Margin | 39.6% | 24.8% | 34.7% | 42.2% | 41.4% |
| Net Margin | 33.4% | 19.9% | 29.0% | 37.9% | 30.1% | |
| Return on Equity (ROE) | 31.5% | 18.5% | 25.5% | 34.2% | 27.8% | |
| Operating Efficiency | Revenue Growth | 37.2% | (1.1%) | 15.7% | 27.3% | 21.6% |
| Asset Turnover | 0.76 | 0.63 | 0.64 | 0.58 | 0.55 | |
| Capital Structure | Debt-to-Equity (D/E) | 0.33 | 0.48 | 0.50 | 0.51 | 0.69 |
| Equity Ratio | 75.3% | 67.4% | 66.8% | 66.1% | 59.4% |
Financial Ratio Analysis
- Profitability: Recovery and AI TransitionMeta’s profitability hit a low in 2022 due to privacy policy changes and heavy Metaverse spending. Between 2023 and 2024, the “Year of Efficiency” cost-cutting measures led to a significant rebound. While the operating margin remained strong at 41.4% in 2025, the net margin decreased to 30.1% due to increased depreciation from AI infrastructure and changes in tax structure.
- Operating Efficiency: Shift to Asset-Intensive ModelAs the company pivots from a lightweight social platform to an AI-heavy infrastructure firm, asset turnover has declined from 0.76 in 2021 to 0.55 in 2025. This indicates that Meta is converting cash into property and equipment at a massive scale to secure a long-term competitive advantage in AI, trading short-term asset efficiency for future capacity.
- Capital Structure: Increased Leverage to Support ExpansionThe capital structure has shifted significantly, with the D/E ratio rising from 0.33 in 2021 to 0.69 in 2025. Meta is now utilizing long-term debt (which grew 104% in 2025) alongside internal cash flow to fund its aggressive AI roadmap. Despite the higher leverage, the total cash reserve of $81.6B ensures that financial risks remain manageable.
Based on the 2025 full-year financial results, Meta’s investments in infrastructure and Research & Development (R&D) reflect an aggressive strategic pivot toward becoming an AI-first company:
Infrastructure Investment (Capital Expenditures, CapEx)
- Spending Surge: Meta’s CapEx reached $72.22 billion for the full year 2025, an 84% increase compared to $39.23 billion in 2024. This represents an unprecedented expansion of physical assets.
- Focus on AI and Data Centers: The primary drivers of this spending are servers (specifically high-performance GPUs like NVIDIA chips for AI training and inference) and the construction of massive data centers. These facilities support both current advertising algorithms and the computational requirements for future generative AI applications.
- Balance Sheet Impact: By the end of 2025, “Property and equipment, net” reached $176.4 billion, a 45% year-over-year increase. This category now accounts for nearly half (48.2%) of Meta’s total assets, signaling a shift from a software-heavy to a capital-intensive business model.
Research & Development (R&D) Investment
- R&D as a Growth Engine: R&D remains Meta’s largest operating expense category. Total costs and expenses rose 24% in 2025 to $117.69 billion, largely driven by technical talent and research initiatives.
- Core Technology Development: Meta continues to invest heavily in its Large Language Models (LLM), such as the Llama series. AI integration within the “Family of Apps” (FoA)—specifically for Instagram Reels recommendations and automated advertising tools—directly fueled the 24% growth in ad revenue in Q4.
- Reality Labs Commitment: Despite an annual operating loss of $21.45 billion in 2025, Meta continues to fund long-term R&D for Augmented Reality (AR) glasses, VR headsets, and the software ecosystem for the metaverse.
Strategic Rationale
Meta’s current investment strategy can be described as “funding the future through the core.” * Cash Flow Utilization: The powerful cash flow generated by the Family of Apps ($115.8 billion in 2025 operating cash flow) is being reinvested into AI.
- Debt Financing: Meta has also doubled its long-term debt (up 104%) to maintain this aggressive investment pace without depleting its $81.6 billion cash reserve.
- Prioritizing Capacity over FCF: While Free Cash Flow (FCF) dropped 16% due to this spending, management has signaled that securing AI compute capacity and infrastructure leadership is a higher priority than short-term cash flow optimization during this pivotal transition.
Meta’s Debt Increase Analysis
| Item | End of 2024 | End of 2025 | Increase (%) |
| Long-term debt | 28,737 | 58,744 | 104% |
| Total liabilities | 93,654 | 148,778 | 59% |
Units: USD Million
Debt Analysis
1. Doubling of Debt Scale
Meta’s long-term debt skyrocketed from approximately $28.7 billion in 2024 to $58.74 billion in 2025, a massive 104% increase. This indicates that the company actively tapped into the capital markets to issue bonds throughout the year.
2. Funding Massive Capital Expenditures
The primary driver for this debt surge is the exorbitant cost of AI infrastructure. With 2025 capital expenditures (CapEx) reaching $72.22 billion, Meta chose to leverage debt financing to maintain its aggressive expansion in AI compute and data centers without significantly depleting its $81.6 billion cash reserve.
3. Transformation of Capital Structure
As debt increased, Meta’s Debt-to-Equity (D/E) ratio rose from 0.51 in 2024 to 0.69 in 2025. This reflects a strategic shift from Meta’s historical “asset-light” model (minimal debt, cash-funded) to a model that utilizes financial leverage to drive “asset-heavy” infrastructure growth.
4. Financial Risk Assessment
Despite the doubling of debt, Meta’s financial health remains exceptionally robust:
- Interest Coverage: Current operating income ($83.28 billion) is more than sufficient to cover interest expenses.
- Cash vs. Debt: Total cash reserves ($81.59 billion) still exceed total long-term debt.
- Borrowing Costs: Given its strong profitability and credit rating, Meta is able to secure long-term funding at relatively low costs.
In summary, the increase in debt is a strategic financing move designed to accelerate the deployment of AI infrastructure, ensuring Meta maintains a leading position in the long-term AI race rather than being a result of operational distress.
Meta Five-Year P/E Ratio Analysis (2021-2025)
The Price-to-Earnings (P/E) ratio reflects market sentiment and valuation levels for Meta. Below is the historical trend based on year-end figures:
| Year | Year-End Stock Price (Approx.) | Diluted EPS | P/E Ratio (Year-End) |
| 2021 | $336 | $13.77 | 24.4x |
| 2022 | $120 | $8.59 | 14.0x |
| 2023 | $354 | $14.87 | 23.8x |
| 2024 | $590 | $23.94 | 24.6x |
| 2025 | $695 | $23.49 | 29.6x |
Valuation Analysis
1. 2022: The Valuation Trough
In 2022, Meta’s P/E ratio compressed to a historical low of approximately 14x. This “de-rating” was driven by several headwinds: Apple’s ATT privacy changes impacting ad tracking, fierce competition from TikTok, and market skepticism regarding the massive, unproven spending on Reality Labs (the Metaverse). At this stage, the market valued Meta more like a low-growth utility than a high-growth tech giant.
2. 2023-2024: The Efficiency Rebound
Following the “Year of Efficiency,” Meta’s P/E expanded back toward its historical average of 23x-25x. The recovery was fueled by successful cost-cutting, the stabilization of the advertising business through AI-driven ad tools (Advantage+), and the successful scaling of Reels. Investors rewarded the company for its renewed focus on profitability.
3. 2025: Premium Valuation Driven by AI
As of the end of 2025, the P/E ratio has expanded further to nearly 30x. This premium valuation suggests that investors are now pricing in “AI Optionality.” Despite a 2% decline in annual EPS (due to infrastructure costs and tax adjustments), the market is willing to pay a higher multiple because of Meta’s dominant position in open-source AI (Llama) and its massive compute moat.
4. Summary of Sentiment Shift
- 2021-2022: Sentiment shifted from “Growth Leader” to “Structural Decline.”
- 2023-2024: Sentiment shifted to “Disciplined Cash Cow.”
- 2025-Present: Sentiment is now “AI Infrastructure Powerhouse,” where the high CapEx is viewed as a barrier to entry for competitors rather than just a cost burden.
Analysis of AI Infrastructure Contribution to Meta’s EPS
To estimate the contribution of AI infrastructure to Meta’s EPS, we analyze the interplay between short-term cost pressures and mid-to-long-term growth drivers.
1. Short-term: EPS Compression (Increased Depreciation and Operating Costs)
The massive capital expenditures (CapEx) in AI infrastructure manifest as a burden on the income statement as equipment is deployed:
- Depreciation Expenses: With 2025 CapEx reaching $72.2 billion, primarily for servers and data centers depreciated over 4–5 years, annual depreciation is expected to increase by $15 billion to $18 billion. This directly reduces operating income.
- Rising Operating Costs: Maintaining large-scale GPU clusters involves significant costs for electricity, cooling, and maintenance. This pressure contributed to the net margin decline from 37.9% in 2024 to 30.1% in 2025.
2. Mid-to-Long-term: EPS Drivers (Core Business Monetization)
The ultimate goal of AI investment is to enhance the efficiency of the core advertising business:
- Improved Ad Yield: Leveraging AI models (like Llama-enhanced algorithms), Meta can more accurately predict user interests. The 24% YoY growth in 2025Q4 ad revenue is largely attributed to AI optimizations in Reels and automated tools (Advantage+).
- Lowering Barriers via Generative AI: Generative AI allows merchants to rapidly create ad creatives, increasing frequency and conversion rates. Higher conversion justifies a higher “Price per ad,” which flows to EPS with minimal marginal cost.
2026Q1 EPS Sensitivity Scenarios
Based on the 2025Q4 diluted EPS of $8.88 and the 2025Q1 base of $4.71, we project the following scenarios for 2026Q1. These estimates account for typical Q1 seasonality (revenue is generally lower than Q4) balanced against the compounding efficiency of AI.
We assume total shares outstanding remain approximately 2.56 billion.
| 2026Q1 Scenario | AI Contribution Description | Est. Revenue (B) | Est. Net Income (B) | Projected EPS |
| Optimistic | AI drives >10% YoY increase in ad pricing, offsetting new depreciation. | $45.5 | $17.3 | $6.75 |
| Base Case | AI maintains engagement; revenue grows 22% YoY, matching investment pace. | $44.5 | $15.9 | $6.21 |
| Conservative | High electricity and depreciation costs outpace ad monetization growth. | $43.0 | $14.1 | $5.50 |
Summary
Meta’s strategy is to “trade short-term EPS volatility for a long-term competitive moat.”
In the upcoming quarter (2026Q1), the true contribution of AI to EPS will be measured by Meta’s ability to maintain >20% revenue growth despite a 30%–40% YoY increase in total expenses. If EPS lands near the $6.21 base case, it indicates that AI monetization is successfully keeping pace with the heavy investment cycle.
Source:
- https://investor.atmeta.com/investor-news/press-release-details/2026/Meta-Reports-Fourth-Quarter-and-Full-Year-2025-Results/default.aspx
- https://investor.atmeta.com/investor-news/press-release-details/2026/Meta-Reports-Fourth-Quarter-and-Full-Year-2025-Results/default.aspx
- https://www.cls.cn/detail/2273480
Also check: