The following is a detailed summary of the Hermès 2025 Full Year Results.
Financial Performance Overview
Hermès achieved a significant milestone in 2025, with annual revenue surpassing the €16 billion mark to reach €16.002 billion. This represents a 9% increase at constant exchange rates despite a challenging global environment and a significant negative currency impact of €515 million. Recurring operating income grew by 7% to €6.569 billion, pushing the recurring operating margin to an exceptional 41%, up from 40.5% the previous year. Net profit (group share) stood at €4.524 billion; while this appears as a slight decrease due to an exceptional tax contribution on large companies in France, the net profit adjusted for this tax actually grew by 5.5%.
Sales Analysis by Sector
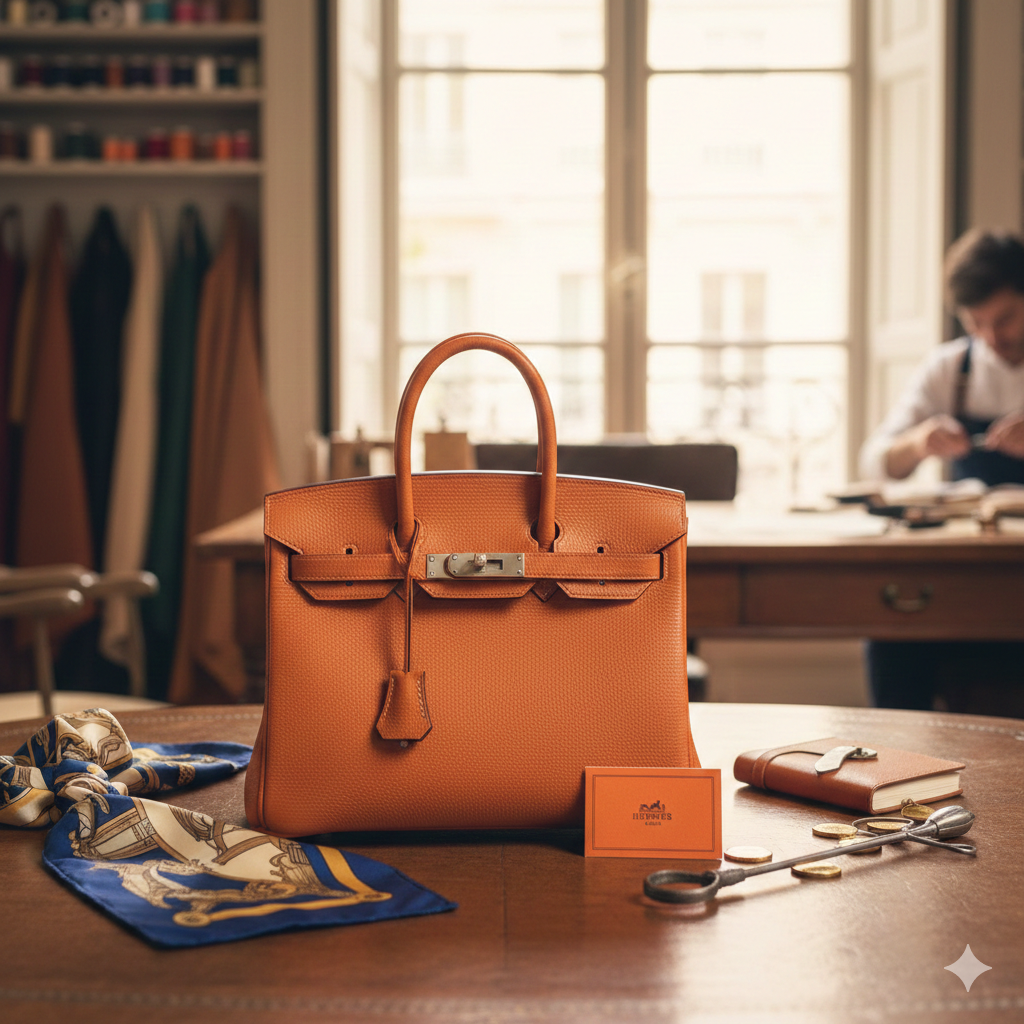
Growth was largely driven by the Leather Goods and Saddlery division, which saw a robust 13.1% increase at constant exchange rates. This performance was supported by sustained demand and the expansion of production capacity, including the inauguration of the house’s 24th leather workshop in Charente. The Ready-to-wear and Accessories sector also remained strong with 6.1% growth. Other Hermès sectors, including Jewelry and Home products, grew by 11.2%. Conversely, Perfume and Beauty declined by 7.6% due to a high comparison basis from 2024, and the Watches division saw a slight 1.5% dip, though it returned to growth in the second half of the year.
Geographical Trends
All geographical regions posted growth in 2025. Japan led the performance with a 14% increase, fueled by the loyalty of local clients. The Americas followed with a 12% rise, supported by new store openings in Arizona and Tennessee. Europe (excluding France) and France itself grew by 11% and 9% respectively, benefiting from both domestic demand and tourism. While Asia excluding Japan grew by 5% overall, it showed accelerating momentum in the fourth quarter with 8% growth as stores in Macau, Korea, and China reopened after renovations.
Cash Flow and Financial Strength
The group maintains an incredibly healthy balance sheet. Operating cash flow reached €5.6 billion. After investing €1.2 billion back into the business (primarily for production facilities and store network improvements) and distributing €2.8 billion in dividends, the restated net cash position increased to €12.8 billion at the end of December 2025. This financial solidity allows the company to continue its long-term investment strategy independently.
Social Responsibility and Outlook
Hermès continued to expand its workforce, adding over 1,300 employees in 2025. In a move to share its success, the company announced a €3,000 bonus for all employees worldwide to be paid in March 2026. Looking forward, the group has set “Venture beyond” as the theme for 2026. Despite ongoing geopolitical and economic uncertainties, Hermès remains confident in its medium-term goal for ambitious revenue growth, supported by its unique artisanal model and creative momentum. A dividend of €18.00 per share will be proposed at the upcoming General Meeting.
Hermès 2025 Income Statement Analysis
| In millions of euros | 2025 | % of total rev | 2024 | % of total rev | yoy |
| Revenue | 16002 | 100% | 15170 | 100% | 5.5% |
| Cost of sales | (4623) | 28.9% | (4511) | 29.7% | 2.5% |
| Gross margin | 11379 | 71.1% | 10660 | 70.3% | 6.7% |
| Sales and administrative expenses | (3704) | 23.1% | (3569) | 23.5% | 3.8% |
| Other income and expenses | (1106) | 6.9% | (942) | 6.2% | 17.4% |
| Recurring operating income | 6569 | 41.0% | 6150 | 40.5% | 6.8% |
| Operating income | 6569 | 41.0% | 6150 | 40.5% | 6.8% |
| Net financial income | 207 | 1.3% | 283 | 1.9% | -26.9% |
| Income tax | (2263) | 14.1% | (1845) | 12.2% | 22.7% |
| Net income – Group share | 4524 | 28.3% | 4603 | 30.3% | -1.7% |
Segment Revenue (at constant exchange rates)
| Sector | 2025 | 2024 | yoy (at CER) |
| Leather Goods and Saddlery | 7070 | 6457 | 13.1% |
| Ready-to-wear and Accessories | 4525 | 4405 | 6.1% |
| Silk and Textiles | 964 | 950 | 4.7% |
| Other Hermès sectors (Jewelry, Home) | 2055 | 1909 | 11.2% |
| Perfume and Beauty | 489 | 535 | -7.6% |
| Watches | 549 | 577 | -1.5% |
| Other products | 349 | 337 | 5.5% |
Key Income Statement Analysis
Resilient Revenue and Margin Expansion
Hermès demonstrated exceptional resilience with a 5.5% increase in revenue (8.9% at constant exchange rates). Notably, the gross margin improved to 71.1%, and the recurring operating margin rose to 41%, up from 40.5% in 2024. This expansion highlights the brand’s superior pricing power and the high desirability of its artisanal products, which shield the company from broader luxury market volatility.
Operational Efficiency
Selling and administrative expenses grew by 3.8%, well below the revenue growth rate, showcasing disciplined cost management even as the group expanded its retail footprint. The 17.4% increase in other expenses primarily reflects investments in production capacity (such as new leather workshops) and one-off employee support measures, including a €3,000 bonus for the global workforce.
Tax Impact on Bottom Line
The reported net income saw a slight decline of 1.7%. This was driven exclusively by an exceptional tax contribution on large companies in France, which pushed income tax expenses up by 22.7%. Excluding this one-time fiscal impact, the adjusted net profit grew by 5.5%, aligning perfectly with the pace of sales growth.
Core Sector Dominance
The “Leather Goods and Saddlery” division remains the group’s primary engine, growing by 13.1% at CER. This was supported by the opening of new production sites and an uncompromising demand for iconic collections. While Perfume and Watches faced headwinds—the former due to a high comparison base and the latter due to a challenging first half—the Watches division notably returned to growth in the second half of 2025.
Hermès 2025 Balance Sheet
| Assets (In millions of euros) | 31/12/2025 | % of total asset | 31/12/2024 | % of total asset | yoy |
| Goodwill | 180 | 0.7% | 228 | 1.0% | -21.1% |
| Intangible assets | 231 | 0.9% | 237 | 1.0% | -2.5% |
| Right-of-use assets | 2002 | 7.9% | 1786 | 7.7% | 12.1% |
| Property, plant and equipment | 3486 | 13.8% | 2980 | 12.9% | 17.0% |
| Financial assets | 1196 | 4.7% | 1050 | 4.5% | 13.9% |
| Investments in associates | 227 | 0.9% | 238 | 1.0% | -4.6% |
| Deferred tax assets | 914 | 3.6% | 929 | 4.0% | -1.6% |
| Other non-current assets | 598 | 2.4% | 586 | 2.5% | 2.0% |
| Non-current assets | 8834 | 35.1% | 8034 | 34.8% | 10.0% |
| Inventories | 2699 | 10.7% | 2430 | 10.5% | 11.1% |
| Trade and other receivables | 1365 | 5.4% | 1289 | 5.6% | 5.9% |
| Current tax assets | 127 | 0.5% | 123 | 0.5% | 3.3% |
| Other financial assets | 1767 | 7.0% | 1680 | 7.3% | 5.2% |
| Cash and cash equivalents | 10408 | 41.3% | 9553 | 41.3% | 8.9% |
| Current assets | 16366 | 64.9% | 15075 | 65.2% | 8.6% |
| Total assets | 25200 | 100% | 23109 | 100% | 9.0% |
Balance Sheet Analysis
Unparalleled Liquidity Position
Cash and cash equivalents, combined with other financial assets, account for nearly 50% of the total assets. The restated net cash position rose to 12.8 billion euros. This massive “cash cushion” provides the group with complete financial independence and the ability to self-fund its long-term industrial projects without relying on external debt.
Strategic Asset Growth
Property, plant, and equipment grew by 17.0%, reflecting the group’s commitment to its vertical integration strategy. This includes the construction of new leather workshops and the renovation of flagship stores worldwide. Right-of-use assets also increased by 12.1%, consistent with the qualitative expansion of its global boutique network.
Inventory Management
Inventories rose by 11.1%, slightly ahead of the 8.9% revenue growth (at constant exchange rates). This is a strategic move to secure stock levels amid increasing demand and to support the opening of new production sites, ensuring that the supply of iconic leather goods can meet market appetite.
Rock-Solid Equity Base
Total equity reached 18.84 billion euros. The balance sheet remains extremely healthy with negligible bank debt, allowing the company to propose an increased dividend of 18.00 euros per share despite the uncertain macroeconomic climate.
Hermès 2025 Cash Flow Statement Analysis
| Item (In millions of euros) | 2025 | 2024 | yoy |
| Operating Cash Flows | 5607 | 5378 | 4.3% |
| Operating Investments (CapEx) | (1161) | (1067) | 8.8% |
| Repayment of lease liabilities | (300) | (271) | 10.7% |
| Adjusted Free Cash Flows (FCF) | 3880 | 3767 | 3.0% |
| Dividends paid | (2800) | (2600) | 7.7% |
| Restated Net Cash Position | 12773 | 12039 | 6.1% |
FCF Analysis Table
| Metric | Value | Description |
| FCF Conversion Rate | 85.8% | As a % of Net Profit (Group share), indicating excellent earnings-to-cash conversion. |
| CapEx Intensity | 7.3% | As a % of total revenue, reflecting a consistent long-term strategy of capacity expansion. |
| Cash Coverage Ratio | 4.56x | Cash holdings comfortably cover all annual capital expenditures and dividend payments. |
Cash Flow Core Analysis
Robust Cash Generation
Operating cash flow grew by 4.3% to €5.607 billion. It is important to note that excluding the impact of the exceptional tax contribution in France, the underlying growth in operating cash flow was a stellar 11%, outperforming the revenue growth rate. This underscores the high efficiency of the group’s business model in generating liquidity.
Strategic Capital Allocation
Capital expenditure (CapEx) increased by 8.8%, primarily directed toward vertical integration. In 2025, the group inaugurated its 24th leather workshop and announced plans for several more sites across France between 2026 and 2030. These investments are vital for securing the supply of iconic leather goods and maintaining long-term growth momentum.
Superior Shareholder Returns and Financial Independence
Despite paying out €2.8 billion in dividends, the group’s restated net cash position actually strengthened to €12.773 billion. This level of self-funding capability allows Hermès to remain entirely independent of external debt, providing a massive competitive advantage and strategic flexibility during periods of global macroeconomic uncertainty.
Hermès Five-Year Financial Ratio Analysis (2021-2025)
The following analysis highlights Hermès’ financial performance, operational efficiency, and capital structure over the past five years, based on its annual reports.
1. Profitability Analysis
| Metric | 2025 | 2024 | 2023 | 2022 | 2021 |
| Gross Margin | 71.1% | 70.3% | 72.3% | 70.5% | 71.3% |
| Operating Margin | 41.0% | 40.5% | 42.1% | 40.5% | 39.3% |
| Net Profit Margin | 28.3% | 30.3% | 32.1% | 29.0% | 27.2% |
| ROA (Return on Assets) | 18.0% | 19.9% | 22.1% | 20.3% | 20.2% |
| ROE (Return on Equity) | 24.0% | 26.6% | 29.1% | 27.2% | 26.4% |
Key Trends:
- Exceptional Pricing Power: Gross margins have consistently remained above 70%, proving the brand’s ability to pass on costs to customers regardless of inflation.
- Profitability Resilience: Despite a temporary dip in Net Margin in 2025 due to a one-off tax contribution in France, the operating profitability remains at historical highs, significantly outperforming the luxury sector average.
2. Efficiency Analysis
| Metric | 2025 | 2024 | 2023 | 2022 | 2021 |
| Inventory Days (DIO) | 205 | 196 | 189 | 195 | 201 |
| Receivables Days (DSO) | 30 | 31 | 30 | 28 | 27 |
| Asset Turnover | 0.63x | 0.66x | 0.69x | 0.70x | 0.74x |
Key Trends:
- Strategic Stockpiling: Inventory days increased slightly over the last two years as the group strategically increased raw material reserves and finished goods to support its vertical integration and growing demand.
- Rapid Cash Cycle: Receivables are collected in approximately 30 days, reflecting a retail-heavy model that ensures fast cash conversion.
3. Liquidity and Solvency Analysis
| Metric | 2025 | 2024 | 2023 | 2022 | 2021 |
| Current Ratio | 3.4x | 3.2x | 3.1x | 3.4x | 3.3x |
| Quick Ratio | 2.8x | 2.7x | 2.6x | 2.9x | 2.8x |
| Debt-to-Assets Ratio | 25.2% | 25.0% | 24.3% | 25.5% | 25.8% |
| Net Cash Position (€M) | 12773 | 12039 | 10850 | 9734 | 7500 |
Key Trends:
- Superior Liquidity: The current ratio of 3.4x indicates an extremely healthy buffer. Cash reserves have grown steadily every year, reaching over €12.7 billion.
- Debt-Free Operation: Hermès operates with virtually zero bank debt. The reported liabilities are primarily lease liabilities (IFRS 16) and operational payables, granting the house complete strategic independence.
Summary Analysis
Over the past five years, Hermès has demonstrated “Ultra-High Quality Growth”:
- Anti-Cyclical Nature: Profitability metrics remained stable or improved even during the high inflation of 2022-2023 and the luxury slowdown in 2024-2025.
- Self-Funded Expansion: All capital expenditures for new production sites and dividend payouts have been fully covered by internal cash flow.
- Stability: While the high cash balance tends to dilute ROE slightly, the 24-29% range remains elite, showing highly efficient capital employment.
Back to Hermes page