Here is the financial analysis of The Walt Disney Company’s Q1 FY2026 (ended December 27, 2025) based on the provided document.
Income Statement
Units: millions of USD (except per share data)
| Item | 2026 Q1 | 2025 Q1 | YoY | % of Total Rev (2026 Q1) |
| Service Revenues | 23,206 | 22,048 | +5.3% | 89.3% |
| Product Revenues | 2,775 | 2,642 | +5.0% | 10.7% |
| Total Revenues | 25,981 | 24,690 | +5.2% | 100.0% |
| Costs of Services | 15,003 | 13,789 | +8.8% | 57.7% |
| Costs of Products | 1,666 | 1,617 | +3.0% | 6.4% |
| Selling, General and Administrative | 4,121 | 3,930 | +4.9% | 15.9% |
| Depreciation and Amortization | 1,316 | 1,276 | +3.1% | 5.1% |
| Segment Operating Income | 4,635 | 5,116 | -9.4% | 17.8% |
| Net Income Attributable to Disney | 2,402 | 2,554 | -6.0% | 9.2% |
| Diluted EPS | 1.34 | 1.40 | -4.3% | — |
| Adjusted EPS | 1.63 | 1.76 | -7.4% | — |
Segment Revenue Analysis
| Segment | 2026 Q1 | 2025 Q1 | YoY |
| Entertainment | 11,461 | 10,670 | +7.4% |
| Sports | 4,435 | 4,402 | +0.7% |
| Experiences | 10,085 | 9,618 | +4.9% |
Balance Sheet
Units: millions of USD
| Item | 2025/12/27 | 2025/09/27 | % of Total Asset (2025/12) |
| Cash and Cash Equivalents | 5,854 | 5,675 | 3.0% |
| Receivables, Net | 14,657 | 13,426 | 7.5% |
| Inventories | 2,063 | 2,143 | 1.1% |
| Content Advances | 1,048 | 1,171 | 0.5% |
| Total Current Assets | 25,979 | 24,312 | 13.2% |
| Content Assets, Net | 36,926 | 34,220 | 18.8% |
| Parks, Resorts and Other Property, Net | 34,510 | 33,966 | 17.6% |
| Goodwill | 77,758 | 77,539 | 39.6% |
| Other Assets | 21,114 | 27,458 | 10.8% |
| Total Assets | 196,287 | 197,495 | 100.0% |
| Long-term Borrowings | 36,104 | 35,270 | 18.4% |
| Total Equity | 107,322 | 107,985 | 54.7% |
Cash Flow Statement & FCF Analysis
Units: millions of USD
| Item | 2026 Q1 | 2025 Q1 | YoY |
| Cash Provided by Operations | 735 | 3,212 | -77.1% |
| Capital Expenditures (CapEx) | 3,041 | 1,889 | +61.0% |
| Free Cash Flow (FCF) | -2,306 | 1,323 | -274.3% |
Key Insights:
- Revenue Growth: Total revenue increased by 5.2%, driven by strong performance in Entertainment (+7.4%) and Experiences (+4.9%). The Experiences segment reached a milestone by exceeding 10 billion USD in quarterly revenue.
- Profitability Pressure: Despite revenue growth, segment operating income decreased by 9.4%. This was primarily due to higher programming and production costs in Entertainment and increased sports rights costs.
- Cash Flow Impact: Free Cash Flow turned negative at -2.3 billion USD. This reflects a significant increase in capital expenditures (up 61% YoY) for theme park expansions and new cruise ships, along with the timing of tax payments and higher content spending.
Here is the five-year financial ratio analysis for The Walt Disney Company (FY2021–FY2025) based on historical financial data.
Profitability Ratios
| Fiscal Year (FY) | 2025 | 2024 | 2023 | 2022 | 2021 |
| Gross Margin | 37.7% | 35.8% | 33.4% | 34.2% | 33.1% |
| Operating Margin | 13.8% | 9.1% | 5.7% | 7.9% | 4.5% |
| Net Profit Margin | 13.1% | 5.4% | 2.7% | 3.8% | 3.0% |
| Return on Equity (ROE) | 11.6% | 4.8% | 2.4% | 3.3% | 2.1% |
Insights:
- Profitability Recovery: Margins were compressed between 2021 and 2023 due to heavy investment losses in Direct-to-Consumer (Disney+) and pandemic-related recovery costs.
- The Turning Point: 2024 and 2025 marked a significant recovery. The operating margin doubled in 2025, driven by the streaming business reaching profitability and strong per-capita spending growth in the Experiences segment.
Liquidity & Solvency Ratios
| Fiscal Year (FY) | 2025 | 2024 | 2023 | 2022 | 2021 |
| Current Ratio | 0.71 | 0.73 | 1.05 | 1.00 | 1.08 |
| Quick Ratio | 0.65 | 0.67 | 0.99 | 0.94 | 1.01 |
| Debt-to-Equity | 0.41 | 0.45 | 0.46 | 0.48 | 0.53 |
Insights:
- Liquidity Tightening: The decline in current/quick ratios below 1.0 in 2024-2025 reflects aggressive capital allocation toward CapEx (new cruise ships and park expansions) and content production.
- Deleveraging: The Debt-to-Equity ratio has steadily improved from 0.53 to 0.41, showing that the company is actively paying down debt accumulated during the pandemic while maintaining growth investments.
Cash Flow & Valuation Metrics
| Fiscal Year (FY) | 2025 | 2024 | 2023 | 2022 | 2021 |
| Free Cash Flow (FCF, $B) | 10.1 | 8.6 | 4.9 | 1.1 | 2.0 |
| P/E Ratio | 16.6 | 41.0 | 70.2 | 50.4 | 91.9 |
Insights:
- FCF Surge: Free Cash Flow hit a multi-year high of 10.1 billion USD in 2025 (nearly 10x the 2022 levels), providing a strong foundation for dividend reinstatements and future growth.
- Valuation Normalization: As earnings recovered sharply, the P/E ratio returned to a more rational range of 16-17x from previously distorted highs.
Summary Trend:
Disney’s trajectory over the last five years shifted from “Pandemic Recovery & Streaming Cash Burn” to “Profitability & Robust Cash Generation.” FY2025 represents a landmark year where the company successfully balanced massive infrastructure investment with significant margin expansion.
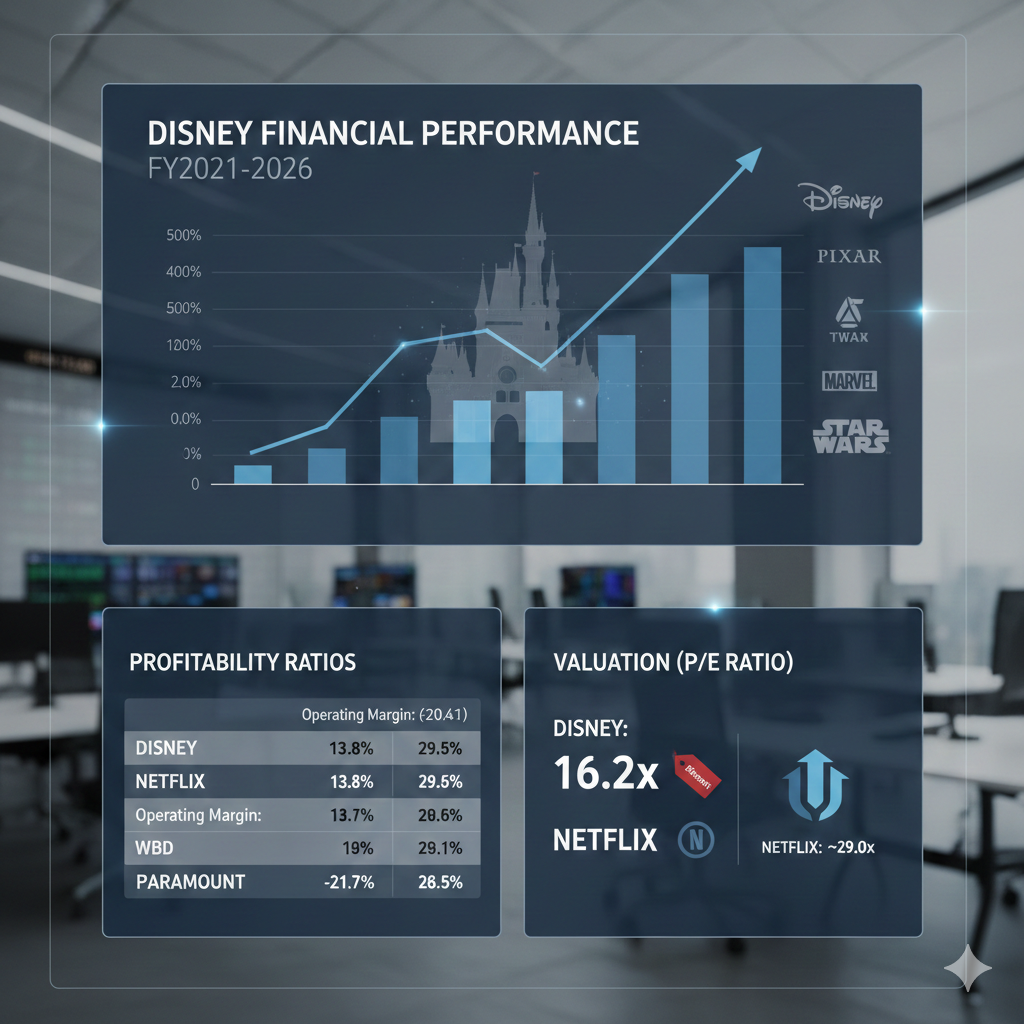
In the market environment of early 2026, the Price-to-Earnings (P/E) ratios of Disney (DIS) and its primary competitors—Netflix (NFLX), Warner Bros. Discovery (WBD), and Paramount—reveal starkly different valuation logics.
2026 Peer Valuation Comparison Table
Units: x (Multiple)
| Company | P/E TTM | Forward P/E | Valuation Status |
| Walt Disney (DIS) | 15.2 – 16.5 | 16.2 | Historical low; below industry average (17.8x) |
| Netflix (NFLX) | 36.5 – 37.7 | ~29.0 | Growth premium; pure-play streaming leader |
| Warner Bros. Discovery (WBD) | 151.3 | — | Merger speculation; earnings highly volatile |
| Paramount Global (PARA) | Negative | — | Financial restructuring; weak market confidence |
Key Competitive Analysis
1. Disney: An Undervalued “Value Stock”?
Disney’s current P/E of approximately 15-16x is not only lower than its five-year average (heavily distorted by pandemic losses) but also sits below the broader U.S. Entertainment industry average.
- Reasoning: The market remains skeptical about the decline of linear television (networks/cable). Additionally, the 6% YoY dip in Q1 2026 net income due to content costs has capped valuation expansion.
- Advantage: Unlike pure streaming players, Disney possesses a “cash flow engine” in its Experiences segment (Parks & Cruises), providing a defensive buffer.
2. Netflix: The Premium “Growth Benchmark”
Netflix maintains a P/E in the 30-40x range as investors treat it as a “Tech Growth” stock rather than traditional media.
- Premium Logic: Its operating margin (approx. 29.5%) far exceeds Disney’s 14.2%. With ongoing merger discussions regarding WBD, investors are willing to pay a premium for its global scale and content efficiency.
3. Warner Bros. Discovery (WBD): Outlier Data & M&A Fever
WBD’s P/E exceeding 150x does not indicate high profitability; rather, it reflects a very small and volatile net income base.
- M&A Speculation: As of early 2026, bidding wars involving Netflix and Paramount (Skydance) have caused stock price volatility that outpaces fundamental performance, making the traditional P/E ratio less reliable for this specific stock.
4. Conclusion: Diversification vs. Pure-Play
- For Stability: Disney is currently trading at an attractive “discount” relative to its historical assets.
- For Momentum: Netflix remains the preferred choice for institutional investors looking for high-certainty earnings growth and operational efficiency.
Source:
Back to Disney page