
Market Position and Market Share
Nintendo Co., Ltd. occupies a pillar position in the global interactive entertainment and video game console industry. In the broader home and portable console market hierarchy, Nintendo commands approximately 24% of the global market share, trailing Sony’s PlayStation (approx. 45%) and running alongside Microsoft’s Xbox ecosystem (approx. 27%).
Financially, Nintendo demonstrates robust scale, posting net sales of approximately ¥2.31 trillion ($14.7 billion) for its fiscal year, with over 75% generated outside of Japan. The commercial rollout of its next-generation hardware platform has rapidly scaled, driving strong hardware and first-party software adoption globally.
Supply Chain Upstream and Downstream Analysis
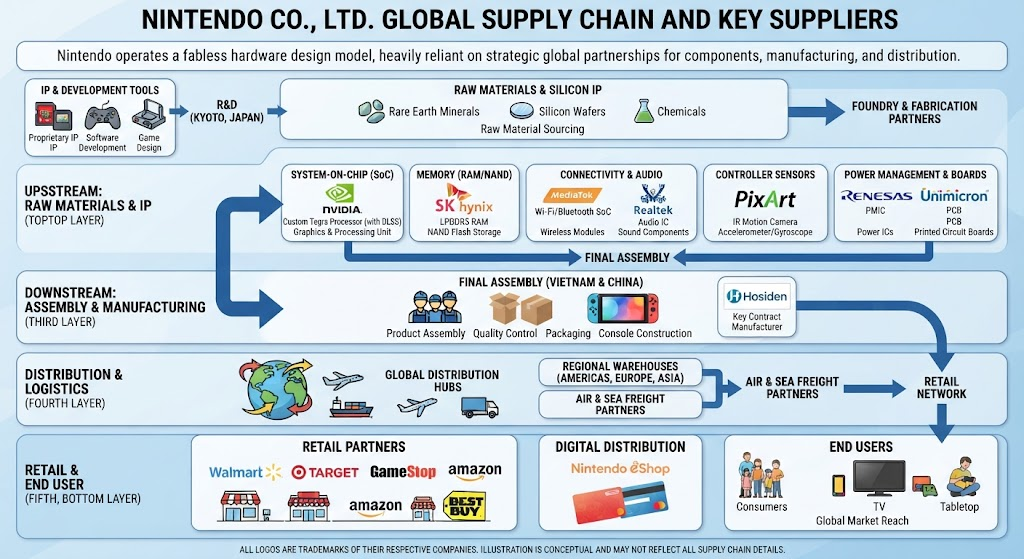
Nintendo operates a fabless hardware design model heavily reliant on specialized global manufacturing and semiconductor partnerships:
- Upstream Semiconductor and Component Providers: NVIDIA supplies the core system-on-chip (SoC), shifting fabrication layout architecture to optimize performance and cost parameters. South Korean giant SK hynix acts as a primary memory supplier, delivering high-speed LPDDR5 RAM and NAND flash components. Taiwanese semiconductor leaders also play vital roles, with MediaTek supplying Wi-Fi and Bluetooth connectivity chips, Realtek providing audio integrated circuits, and Unimicron delivering specialized printed circuit boards (PCBs). PixArt handles sensor components for controllers.
- Midstream Assembly and Manufacturing: Final hardware assembly is heavily concentrated in Southeast Asia, specifically manufacturing hubs in Vietnam, managed alongside key assembly partners such as Hosiden.
- Downstream Distribution and Retail: Finished hardware and physical software cartridges flow through global logistics networks to major regional distributors, big-box physical retailers, and digital storefronts (Nintendo eShop) managed directly by Nintendo’s regional subsidiaries in the Americas, Europe, and Asia.
Competitor Analysis: Technical and Financial Comparison
Nintendo competes directly with Sony Interactive Entertainment and Microsoft Gaming, though it maintains a distinct strategic blueprint focused on proprietary IP rather than raw computational brute force:
- Technical Comparison: While Sony’s PlayStation 5 and Microsoft’s Xbox Series X/S prioritize high-end 4K native rendering, ray tracing hardware, and heavy-duty custom SSD architectures, Nintendo emphasizes versatility, blending portable mobile architecture with home-docked play. Nintendo’s hardware relies on highly efficient custom architectures (such as NVIDIA-powered Tegra variants supporting advanced upscaling tech like DLSS) to maximize battery life and thermal efficiency at a consumer-friendly price point, contrasting with the power-hungry, bulky architectures of its primary rivals.
- Financial Comparison: Sony generates massive hardware and third-party royalty streams through its roughly 45% market dominance, though its operating margins fluctuate based on heavy hardware subsidies. Microsoft has increasingly pivoted away from pure hardware sales—where Xbox hardware revenue has experienced sharp declines—toward software, multiplatform publishing, and subscription services like Xbox Game Pass (which generates nearly $5 billion annually). In contrast, Nintendo’s financial engine thrives on extremely high-margin first-party software sales (such as Mario, Zelda, and Pokémon franchises) and synergistic hardware ecosystems, giving it unique profit resilience during console transition cycles.
Information Sources
- https://www.pocketgamer.biz/nintendo-switch-2-nears-20m-unit-sales-in-under-a-year-but-shares-have-tanked-40/
- https://www.6wresearch.com/market-takeaways-view/console-market-share
- https://www.trendforce.com/news/2025/05/13/news-taiwanese-tech-firms-poised-to-gain-from-switch-2-supply/
- https://respawn.outlookindia.com/gaming/gaming-news/xbox-beats-sony-and-nintendo-in-2026-publisher-metacritic-rankings
back to Nintendo