Market Position and Market Share
Mitsui & Co., Ltd.(TYO: 8031) ranks among Japan’s premier “Sogo Shosha”(general trading houses), consistently holding the #2 to #3 position in Japan across net profit, total revenue, and market capitalization, trailing closely behind Mitsubishi Corporation and Itochu Corporation.
- Overall Industry Ranking: Within Japan’s five major trading houses(Mitsubishi, Mitsui, Itochu, Sumitomo, Marubeni), Mitsui generated consolidated revenue of ¥13.99 trillion to ¥14.66 trillion($93.6B to $98B) and consolidated net income exceeding ¥830 billion to ¥1.06 trillion depending on commodity price cycles, placing it #2 or #3 among peers.
- Energy & LNG Market Share: Mitsui is Japan’s foremost trading house in liquefied natural gas(LNG). Mitsui accounts for an equity-based LNG production capacity of approximately 10 to 12 million tonnes per annum(MTPA), securing roughly 12% to 15% of Japan’s total LNG import volumes through long-term off-take and equity contracts.
- Mineral & Metal Resources: In iron ore, Mitsui controls roughly 60+ million tonnes of annual equity production through joint ventures with Rio Tinto and BHP in Western Australia, commanding a significant single-digit share(estimated 3% to 4%) of seaborne global trade and over 15% of Japan’s imported iron ore supply.
- Chemicals & Healthcare: Mitsui is the world’s leading marketer of merchant-grade ammonia and methanol through joint ventures like Celanese-Mitsui. In healthcare, Mitsui is the largest single shareholder(with an equity stake exceeding 30%) in IHH Healthcare Berhad, one of the world’s largest private healthcare networks by bed capacity and market capitalization.
Supply Chain Upstream, Downstream, and Key Suppliers
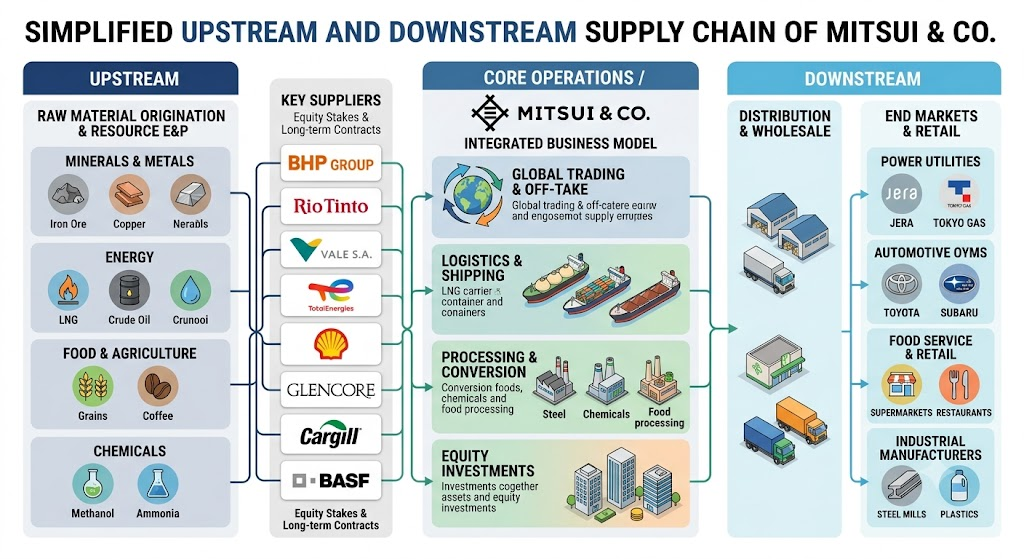
Mitsui’s business model operates as an integrated value chain architect rather than a passive intermediary, deploying balance sheet equity upstream to secure global physical commodity flows.
- Upstream Extraction & E&P:
- Metals & Mining: Mitsui secures upstream tier-1 supply via direct equity stakes in long-life, low-cost extraction assets. Key resource assets include the Robe River and Mount Newman joint ventures in Australia(co-owned with Rio Tinto and BHP) and Minera Los Pelambres copper operations in Chile.
- Energy E&P: Mitsui’s upstream energy assets include substantial equity interests in Cameron LNG(USA), Sakhalin-2(Russia), Mozambique LNG(Area 1), and deepwater blocks in the Gulf of Mexico via its subsidiary Mitsui E&P USA.
- Key Upstream Partners & Suppliers: BHP Group, Rio Tinto, Vale, Sempra Infrastructure, TotalEnergies, and ADNOC.
- Midstream Processing, Logistics, and Fleet Infrastructure:
- Maritime Transport & Logistics: Mitsui operates proprietary fleets of LNG carriers, dry bulk carriers, and product tankers, frequently chartering vessels through affiliates such as Mitsui O.S.K. Lines(MOL) and standalone logistics entities.
- Terminaling & Conversion: The company owns and operates global tank terminals, chemical storage facilities(such as Intercontinental Terminals Company in the US Gulf Coast), and agricultural processing terminals.
- Steel Processing: Downstream from upstream iron ore, Mitsui operates metal processing centers, coil distribution centers, and specialized tube fabrication units worldwide through Mitsui & Co. Steel.
- Downstream Off-Take, Utility Distribution, and Industrial Customers:
- Power & Gas Utilities: Sells pipeline gas, LNG, and power directly to major utilities globally, including Tokyo Gas, JERA, Kansai Electric, and European energy distributors.
- Industrial & Automotive: Feeds specialized steel, synthetic resins, basic chemicals, and battery materials directly to automotive OEMs(including Toyota-affiliated tier-1 suppliers and Gestamp Automocion) and electronics manufacturers.
- Food & Retail Distribution: Downstream food channels operate via Mitsui Food, Vendor Service, and agribusiness investments(e.g., Ventura Foods and United Farmers of Alberta).
Competitor Analysis: Strategic, Technical, and Financial Comparison
Mitsui’s core competitors are Japan’s other four top sogo shosha, as well as global commodity trading desks like Glencore and Trafigura.
- Strategic & Portfolio Structure Comparison:
- Mitsui vs. Mitsubishi Corporation: Mitsubishi possesses a broader corporate footprint with strong industrial machinery, automotive(Mitsubishi Motors), and convenience store holdings(Lawson). Mitsui, by comparison, maintains higher capital intensity and asset concentration in upstream resources(Energy and Mineral/Metals generate 55% to 65% of Mitsui’s net profit).
- Mitsui vs. Itochu Corporation: Itochu prioritizes non-resource consumer downstream operations, generating consistent cash flow through FamilyMart, textile licensing, and retail distribution, providing stability during commodity downcycles. Mitsui is fundamentally an infrastructure, resource, and B2B industrial house with lower direct consumer exposure.
- Mitsui vs. Sumitomo & Marubeni: Sumitomo excels in steel tubular products, media, and mining(Ambatovy nickel), while Marubeni leads in grain origination and independent power projects(IPP). Mitsui holds an advantage over both in balance sheet scale, global LNG concessions, and international medical networks.
- Technical & Digital Transition Capabilities:
- Energy Transition Technologies: Mitsui leads peers in next-generation fuel initiatives, committing capital to green/blue ammonia synthesis, carbon capture and storage(CCS) ventures in the UK North Sea and Asia-Pacific, and advanced nuclear energy ecosystems(including investments in Helion Energy).
- Operational Digitalization: Mitsui utilizes proprietary algorithmic commodity trading, AI-driven vessel routing, and digital asset tracking across bulk ports, whereas peers like Itochu emphasize consumer-facing AI implementations(store automation, digital retail signage).
- Financial Performance Comparison(FY2024–FY2025 Benchmarks):
- Consolidated Net Income: Mitsubishi(~¥800B to ¥960B) and Itochu(~¥880B to ¥900B) closely contend with Mitsui(~¥830B to ¥1.06T). Mitsui delivers higher earnings upside during commodity bull markets but experiences wider volatility during cyclical downturns.
- Return on Equity(ROE): Itochu maintains the highest and least volatile ROE among peers(typically 14% to 16%) due to asset-light consumer businesses. Mitsui posts an ROE range of 10% to 13%, outperforming Sumitomo and Marubeni.
- Balance Sheet & Financial Leverage: Mitsui maintains a conservative capital profile with a Net Debt-to-Equity ratio of approximately 0.45x to 0.48x and an equity ratio of ~45%, comparable to Mitsubishi(0.41x) and Itochu(0.46x), and stronger than Sumitomo(~0.68x).
Information Sources
- https://www.mitsui.com/jp/en/ir/index.html
- https://en.wikipedia.org/wiki/Mitsui_%26_Co.
- https://umbrex.com/resources/company-profiles/mitsui-co-ltd/
- https://www.hdinresearch.com/news/1544
- https://note.com/hot_japa_stock/n/n56748678ffc0
- https://www.researchgate.net/publication/396972258_A_Study_on_Japanese_General_Trading_Companies’_Overcoming_of_Crisis
back to Mitsui