
Latest Financial Results Summary (Q2 2026)
Euronext N.V. delivered record performance in Q2 2026, marking its ninth consecutive quarter of double-digit top-line growth:
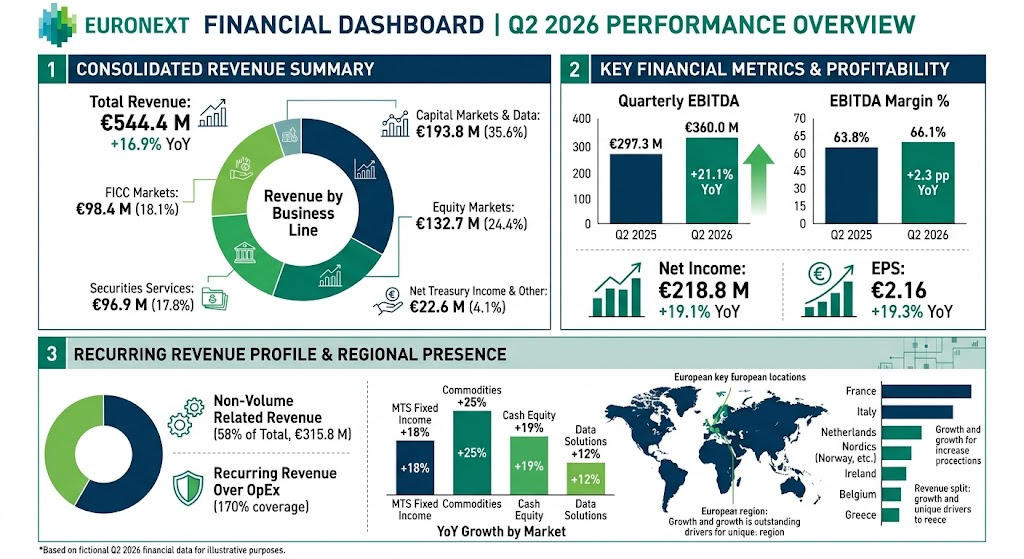
- Underlying Revenue and Income:€544.4 million, up +16.9% YoY (+9.9% on a like-for-like and constant currency basis).Reported revenue stood at €543.5 million (+16.7% YoY).
- Adjusted EBITDA:€360.0 million, up +21.1% YoY, resulting in an adjusted EBITDA margin of 66.1% (an increase of 2.3 percentage points YoY), demonstrating substantial operational leverage.
- Net Income and EPS:Reported net income attributable to shareholders rose +19.1% YoY to €218.8 million, with reported EPS of €2.16 (+19.3% YoY).Adjusted net income reached €245.0 million (+19.9% YoY) with adjusted EPS of €2.42 (+19.8% YoY).
- Operating Expenses:Underlying operating expenses excluding D&A totaled €184.4 million (+9.5% YoY), reflecting investments in strategic growth and acquisition consolidations in line with annual cost targets.
- Balance Sheet Health:The net debt to EBITDA leverage ratio stood at 1.3x at the end of June 2026, well within the company’s strategic target corridor of 1.0x–2.0x.
Revenue Breakdown by Business Segment & Regional Development
According to official reporting classifications, Euronext categorizes revenue into non-volume-related businesses (58% of total) and volume-driven trading/clearing businesses:
- Capital Markets and Data Solutions (35.6% of underlying revenue, €193.8 million, +17.2% YoY):Covers Primary Markets listings (€54.2 million, listing and corporate admission fees), Advanced Data Solutions (€72.3 million, proprietary index calculations and real-time market data feeds), and Corporate/Investor Solutions and Technology Services (€67.3 million, governance software, SaaS tools, and exchange tech solutions).Growth was boosted by renewed listing momentum and the consolidation of Admincontrol and Euronext Athens.
- Equity Markets (24.4% of underlying revenue, €132.7 million, +24.9% YoY):Encompasses Cash Equity trading and clearing (€118.5 million) and Equity Derivatives trading and clearing (€14.1 million).Expansion was driven by high secondary market trading volume, strong structural ETF adoption (+84% traded daily value since late 2025), and Greek market integration.
- FICC Markets (18.1% of underlying revenue, €98.4 million, +12.3% YoY):Includes Fixed Income trading and clearing (€55.9 million, via MTS), Commodities trading and clearing (€34.0 million, Nord Pool power and agricultural futures), and Foreign Exchange trading (€8.5 million via Euronext FX).Growth was driven by consecutive monthly record volumes in sovereign fixed income and full-quarter consolidation of Nord Pool Power Futures.
- Securities Services (17.8% of underlying revenue, €96.9 million, +12.5% YoY):Comprises Central Securities Depositories (CSD) Custody and Settlement (€88.1 million) and other post-trade services (€8.8 million).Driven by record levels of assets under custody (AUC) across European entities and rising institutional demand for value-added tax/settlement tools.
- Net Treasury Income & Other (4.1% of underlying revenue, €22.6 million, +12.5% YoY):Treasury returns on cash collateral deposited at Euronext Clearing, boosted by higher collateral linked to power contracts and interest rate volatility.
Regional Presence and Geographic Dynamics:
Euronext operates as an integrated pan-European market infrastructure spanning eight domestic markets: France (Paris), Italy (Borsa Italiana/Milan), the Netherlands (Amsterdam), Belgium (Brussels), Ireland (Dublin), Norway (Oslo), Portugal (Lisbon), and Greece (Athens).
- France & Italy:Generate the lion’s share of listing capitalization and fixed income activity, with MTS dominating Italian sovereign bond liquidity and officially becoming the reference administrator for French sovereign debt benchmarks in 2026.
- Nordics (Norway) & Continental hubs: Anchor power commodity operations (Nord Pool) and seafood listings (Fish Pool), alongside expanding retail investor engagement.
- Athens: Provides dynamic incremental equity and bond market listing flow, including the historic onboarding of major international shipping players.
Quarterly Drivers, Future Outlook & Key Monitoring Indicators
Q2 2026 Changes & Drivers:
- Diversification vs. Volatility:Non-volume recurring revenue streams accounted for 58% of top-line income and covered 170% of operating expenses (ex-D&A), insulating the core platform from cyclical drop-offs in equity turnover.
- FICC Expansion:MTS expanded internationally beyond Italy into France and Spain, achieving scale comparable to domestic Italian operations.
- Acquisition Synergies:The integration of Euronext Athens and Admincontrol contributed accretive inorganic recurring revenues with limited cost additions.
Future Outlook & Strategic Objectives:
- Under the “Innovate for Growth 2027” strategic plan, management targets >5% CAGR for organic revenue and >5% CAGR for adjusted EBITDA through 2027, with CAPEX controlled between 4% and 6% of total revenue.
- European Regulatory Tailwinds:The European Commission’s Market Integration and Supervision Package aims to reduce EU cross-border trading fragmentation, giving scaled multi-market operators like Euronext significant clearing and execution tailwinds.
Key Indicators for Next Quarter (Q3 2026):
- Cost Guidance Revision:Updated operational expense and tech investment guidance scheduled for November 2026 earnings.
- AI Operational Efficiency: Progress updates on AI automation deployed across post-trade surveillance, compliance processing, and customer support.
- CSD Issuer Migration: Monitoring issuer migration traction toward Euronext Securities and competitive post-trade market share retention.
- Listing Pipeline: Sustainability of IPO and follow-on market momentum amid global macro interest-rate cuts.
Recent 3-Month Stock Price Performance & Market Drivers
Over the trailing three-month period (June through early September 2026), Euronext shares (ENX.PA) demonstrated robust upward momentum, rising from ~€138.00–€142.00 in early June to approximately €159.20 by September 2026 (a gain of roughly +12% to +15%).
- Late July Earnings Beat: The primary catalyst was the Q2 2026 results announced on July 30, where adjusted EPS of €2.42 beat market consensus estimates (€2.20–€2.23) by over 8%, propelling the stock upward by ~5% in subsequent sessions.
- Expansion of Profit Margins:Adjusted EBITDA margin reaching 66.1% (+2.3 percentage points) reassured investors that cost discipline remained intact despite targeted tech and AI investments.
- Post-Trade De-risking & Cash Returns:Continuous deleveraging (net debt/EBITDA at 1.3x) supported ongoing share repurchases and solid dividend yield sustainability (~2%).
Information Sources
- https://www.euronext.com/en/investor-relations/financial-information/news/euronext-publishes-q2-2026-results
- https://www.euronext.com/en/investor-relations/financial-information/news/euronext-announces-its-new-strategic-plan-innovate
- https://www.euronext.com/en/investor-relations/share-price
- https://www.investing.com/news/transcripts/earnings-call-transcript-euronext-beats-q2-2026-forecasts-as-stock-nears-record-93CH-4827024
- https://en.wikipedia.org/wiki/Euronext
Back to Euronext