
Latest Financial Results Summary (Q2 2026)
KBC Group reported its second-quarter 2026 financial results on August 6, 2026, delivering a net profit of €1,152 million, up 13% year-over-year from €1,018 million in Q2 2025. Total net profit for the first half of 2026 reached €1,709 million, an increase of 9% year-over-year.
The quarter was highlighted by strong net interest income (NII) of €1,805 million (up 20% year-over-year) and record fee generation.Net interest margin expanded to 2.23% (up 6 bps quarter-over-quarter).Return on Tangible Equity (ROTE) reached 18%, while the Common Equity Tier 1 (CET1) ratio stood firm at 14.4%.Operating efficiency remained strong with an operational cost-to-income ratio of 40% (excluding bank/insurance taxes).
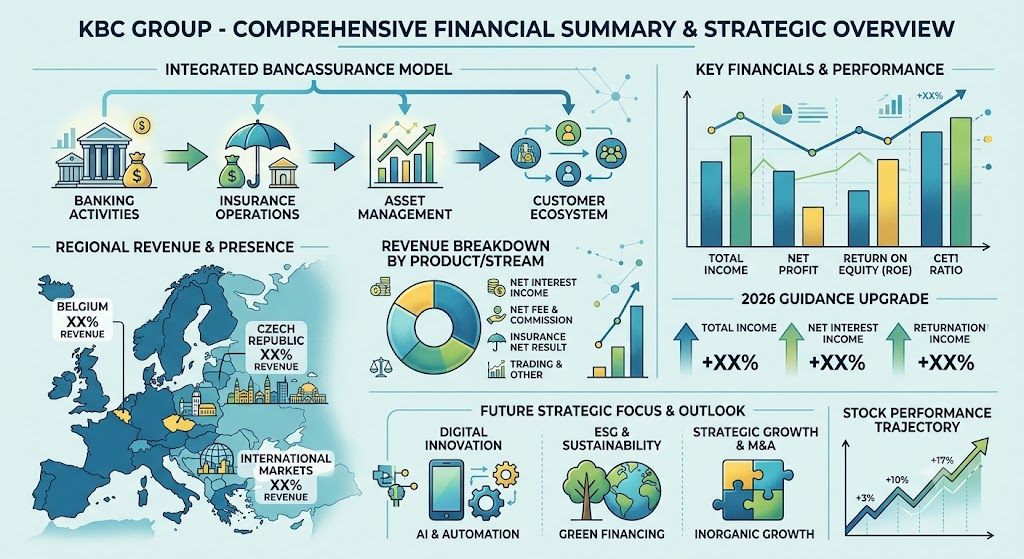
Revenue Breakdown by Division, Product & Geography
Business Unit / Segment Revenue Breakdown (Q2 2026)
KBC Group operates primarily as an integrated bank-insurer.Its revenue structure is split nearly evenly between interest income and non-interest income streams:
- Net Interest Income (~50-55% of total income / €1,805M):Driven by core banking operations including retail, SME, and corporate lending, commercial transformation results, and inflation-linked bond yields.Organic loan volume grew 7% year-over-year to €222 billion.
- Net Fee & Commission Income (~22% of total income / €758M):Includes asset management services (€437M) and banking distribution fees (€308M), supported by record management fees and payment processing volumes.Total Assets under Management (AuM) expanded 17% year-over-year.
- Insurance Operations (~10-12% of total income / €169M net service result):Encompasses both Non-Life (€111M result) and Life (€58M result) segments.Non-life sales grew 10% year-over-year to €739 million with a strong combined ratio of 85%.
- Trading, Fair Value & Other Income (~10-15% of total income):Generated via financial market trading activities, asset liability management (ALM), and dividend income.
Geographical Revenue & Business Overview
KBC operates through core regional Business Units centered in North-Western and Central/Eastern Europe:
- Belgium Unit (~55-60% of earnings): The anchor market providing high-margin retail banking, corporate banking, and integrated bancassurance services. Loan and deposit performance remained robust during the quarter.
- Czech Republic Unit (~20-25% of earnings): Operates through ČSOB, delivering strong credit demand and digital banking adoption. Expanded via the recent acquisition of Business Lease.
- International Markets Unit (~15-20% of earnings): Encompasses operations in Hungary, Slovakia, and Bulgaria. Slovakia showed notable inorganic growth following the consolidation of 365.bank.
Key Quarterly Changes, Next Quarter Watch Points & Outlook
Key Changes This Quarter
- Upgraded FY2026 Guidance:Management raised full-year 2026 total income growth targets to ~11.0% YoY (up from ≥9.9%) and expanded Net Interest Income guidance to ~€7.05 billion (up from ≥€6.725B).
- M&A Integration:Recent strategic acquisitions of 365.bank (Slovakia) and Business Lease (Czech Republic/Slovakia) added €29 million to H1 2026 net profit.
- Capital Optimization:Successfully completed a €1.25 billion Significant Risk Transfer (SRT) transaction on a corporate loan book, yielding a €0.7 billion reduction in Risk-Weighted Assets (RWA).
Next Quarter & Future Outlook (H2 2026 Focus Points)
- Loan Growth Normalization:Organic loan growth is expected to moderate in H2 2026 from the 2.8% quarterly pace seen in Q2 toward a normalized annual run rate of ≥6%.
- Inflation-Linked Portfolio Volatility: NII gains were significantly boosted by a €45M contribution from inflation-linked bonds in Q2 (vs. -€12M in Q1 2026); monitoring yield curve shifts will be critical.
- Credit Quality & Cost of Risk:Implied credit cost ratio remained at a benign 0.11 bps (well below the 25-30 bps target through the cycle). Investors will watch for potential macroeconomic strain in Central Europe.
- Capital Returns:An interim dividend of €1.00 per share was declared for payment in November 2026.
Stock Price Performance (Past 3 Months)
Over the past three months (May 2026 – August 2026), KBC Group’s stock (EBR: KBC) demonstrated strong upward momentum, surging +17.2% from €113.95 in late May to €133.60 as of late August 2026.
Market Drivers Behind the Price Action:
- May to Mid-July (€113.95 – €121.00): Shares traded in a steady upward trajectory as the market digested resilient Q1 results and digested front-loaded European bank tax impacts.
- Late July to August (€121.00 – €133.60): The stock experienced a sharp rally following the August 6 earnings release. Investors responded enthusiastically to double-digit revenue growth, a double guidance upgrade for FY2026, and strong return-on-equity metrics (18% ROTE). Analyst upgrades and fair-value re-ratings further supported the share price near all-time high ranges.
Sources
- https://www.kbc.com/nl/landing-pages-info/kbc-share-price.html
- https://ml-eu.globenewswire.com/Resource/Download/69d4be77-0f0d-45bd-966b-5cb9d0420887
- https://www.investing.com/news/company-news/kbc-group-q2-2026-slides-strong-results-drive-guidance-upgrade-93CH-4840503
- https://www.morningstar.com/stocks/xbru/kbc/quote
- https://www.ad-hoc-news.de/boerse/news/corporate-news/kbc-group-stock-holds-steady-as-market-data-frame-the-outlook/69995719
Back to KBC