
Latest Earnings Summary
Legrand published its H1 / Q2 2026 financial results on July 29, 2026. The Group delivered strong financial performance driven by accelerating demand in data center infrastructure and strategic acquisitions.
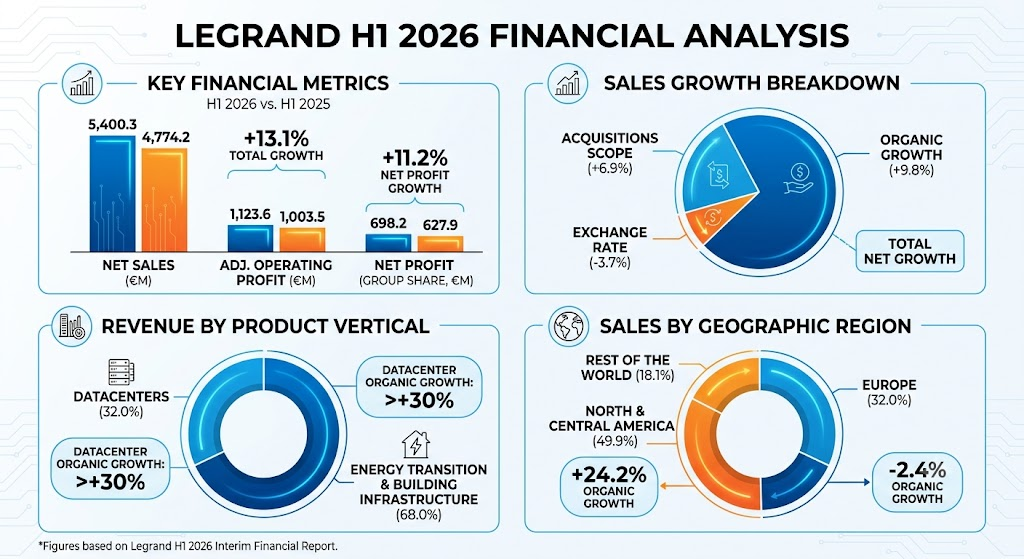
- Net Sales: Reached €5,400.3 million in H1 2026, up +13.1% year-over-year (+17.4% excluding currency impacts).
- Organic Growth: Expand by +9.8% like-for-like in H1, with Q2 organic growth hitting +10.4%.
- Impact of Scope: M&A consolidation contributed +6.9% to overall top-line growth.
- Adjusted Operating Profit: Rose +12.0% to €1,123.6 million, maintaining an adjusted operating margin of 20.8% of sales (compared to 21.0% in H1 2025).
- Net Profit: Group share grew +11.2% to €698.2 million.
- Free Cash Flow: Totaled €488.3 million (9.0% of sales), temporarily constrained by working capital requirements supporting rapid data center expansion.
Revenue Breakdown by Product & Geography
Legrand categorizes its revenues by high-growth product verticals and key geographic destinations.
Product Verticals
- Datacenters (32.0% of Revenue): Encompasses power distribution units (PDUs), busways, liquid cooling equipment, server racks, and cable management. Datacenter organic revenue accelerated by over +30% year-over-year in H1 2026 due to robust demand from hyperscalers expanding AI compute capacity.
- Energy Transition & Building Infrastructure (68.0% of Revenue): Covers electrical wiring devices, user interfaces, smart building automation, low-voltage power distribution, and emergency lighting. Organic sales remained mostly flat to low-single-digit amid soft conditions in residential and commercial construction markets globally.
Geographic Breakdown
- North and Central America (49.9% of Revenue): Posted strong performance with organic sales up +24.2% in H1 2026 (led by +26.7% organic growth in the United States), driven by data center expansions and bolt-on acquisitions.
- Europe (32.0% of Revenue): Sales declined -2.4% on a like-for-like organic basis due to persistent weakness in European residential and commercial building construction.
- Rest of the World (18.1% of Revenue): Increased +2.3% organically in H1 2026 (+6.3% in Q2), propelled by double-digit growth in India and Australia, which offset ongoing macro softness in China.
Quarterly Changes, Key Metrics & Future Outlook
Quarterly Performance & Operational Metrics
Working capital stood at 14.0% of sales in H1 2026 compared to historical averages of ~12.0%, reflecting deliberate inventory builds to fulfill fast-turnaround server rack and power distribution orders for AI data centers. The company completed 7 strategic bolt-on acquisitions during H1 2026, adding roughly €450 million in annualized sales. Net financial debt reached €5,755 million, maintaining a healthy leverage ratio of ~2.4x EBITDA.
Upwardly Revised Full-Year 2026 Outlook
Following its strong first-half results, Legrand officially raised its full-year 2026 guidance targets:
- Total Sales Growth (excl. FX): Revised upward to between +16% and +19% (previously +10% to +15%).
- Organic Sales Growth: Raised to between +8% and +10% (previously +4% to +7%).
- Acquisition Scope Effect: Expected to contribute ~+8% (previously +6% to +8%).
- Datacenter Organic Growth: Raised to +25%–+30% (previously ~+20%).
- Adjusted Operating Margin: Projected between 20.5% and 21.0% of sales.
Key Observations for Upcoming Quarters
- Capital Markets Day: Legrand will detail its long-term strategic roadmap and AI data center expansion plans in Singapore on September 29, 2026.
- Cash Flow Normalization: Management expects free cash flow conversion to return to its standard 13%–15% range of sales in H2 as inventory normalizes.
- Margin Defense in Europe: Monitoring price-cost spreads and cost-discipline measures as European residential construction bottoms out.
Three-Month Stock Performance & Market Drivers
Over the past three months (mid-May 2026 to mid-August 2026), Legrand’s stock price (EPA: LR) fell by approximately -10.4%, shifting from €151.55 in early May down to €135.75 by mid-August. The stock previously reached its 52-week high of €166.95 in mid-2026.
Market Drivers
- Broad Sector Profit-Taking: European industrial capital goods equities experienced widespread profit-taking across June and July 2026 following multi-quarter rallies.
- Earnings & Cash Flow Disappointment: Despite raising full-year revenue guidance on July 29, 2026, the stock dropped over 2% post-earnings. Short-term investors reacted negatively to a minor Q2 EPS miss (€1.47 actual vs. €1.56 consensus) and softer free cash flow conversion (9.0%).
- Macro Divergence: Investors continue to weigh rapid secular growth in AI data centers against persistent macro headwinds in European building construction.
Information Sources
- https://www.legrand.com/en/news/2026-first-half-results
- https://www.legrand.com/sites/default/files/Documents_PDF_Legrand/Finance/2026/6m/Legrand_Press_Release_Results_6M2026_1785247989.pdf
- https://www.investing.com/news/company-news/legrand-h1-2026-slides-data-centers-drive-record-growth-guidance-raised-93CH-4818834
- https://www.investing.com/news/earnings/legrand-lifts-fullyear-guidance-after-strong-h1-driven-by-datacenter-growth-4819055
- https://www.investing.com/equities/legrand
Back to Legrand