
CME Group Q1 2026 Financial Summary:
Financial Highlights
- Revenue: 1.88B USD, an increase of 14.5% year-over-year and 14.0% quarter-over-quarter.
- Market Performance: Average Daily Volume (ADV) reached a record 8.7M contracts, up 8% compared to Q1 2025.
- Open Interest: Average daily open interest was 10.9M contracts, a 1% increase year-over-year.
Operational Overview
According to the Q1 equity index product recap, the quarter showed strong performance, with both trading volume and market participation demonstrating positive growth trends.
CME Group delivered robust performance in Q1 2026, reinforcing its position as a global leader in financial risk management. Below are the key changes and highlights from the quarter:
Operational Performance Records
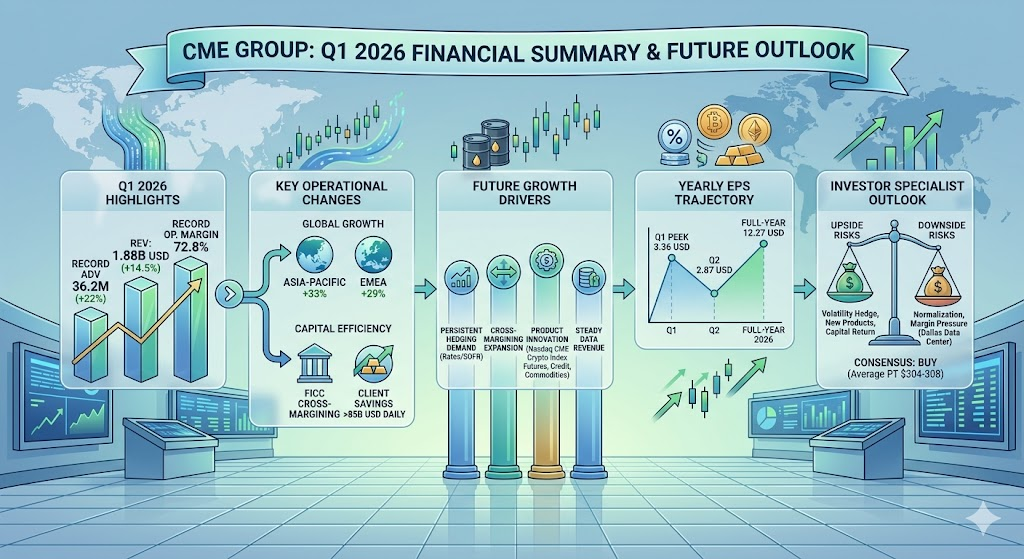
- Record Trading Volume: Average Daily Volume (ADV) hit a record of 36.2M contracts, up 22% year-over-year. Growth was broad-based, spanning all six asset classes, reflecting heightened global demand for hedging tools.
- Surge in Global Participation: Non-U.S. ADV grew significantly to 11.4M contracts, a 30% increase. The Asia-Pacific (APAC) region grew by 33%, while the EMEA region saw a 29% increase.
- Stable Data Revenue: Market data revenue reached a record 224M USD, marking 32 consecutive quarters of year-over-year growth.
Financial Highlights
- Revenue and Profit Growth: Total revenue reached 1.88B USD, up 14% year-over-year. Adjusted net income and adjusted diluted earnings per share (EPS) both rose 20% compared to the same period last year.
- Exceptional Operating Efficiency: The adjusted operating margin reached 72.8%, the highest level in company history.
- Capital Return: Demonstrating strong financial health, the company paid approximately 2.7B USD in dividends and repurchased 536M USD in common stock during the first quarter.
Strategic Developments
- Enhanced Capital Efficiency: Through optimized clearing services, the company saved clients an average of over 85B USD in daily collateral requirements, further solidifying its role as a global hub for liquidity and hedging.
- Cross-Margining: The company plans to further expand cross-margining agreements with the Fixed Income Clearing Corporation (FICC), expected to provide even greater capital efficiency for end-users.
- Continued Innovation: Innovation in digital assets and cross-asset class products remains a core growth strategy.
Risks and Challenges
While financial performance was excellent, management and market analysts continue to monitor the following:
- Macro Environment: Geopolitical tensions may impact energy market volatility, and the ongoing economic transition period could influence investor sentiment.
- Regulatory and Competitive Landscape: Regulatory shifts in the digital asset space and potential entry of competitors remain key areas that the company must navigate.
CME Group delivered exceptional results in Q1 2026, and its growth momentum for the coming quarters is driven by structural market demand and strategic product innovation. Key growth drivers include:
1. Persistent Demand for Hedging
- Interest Rate Volatility: As market expectations regarding interest rate policy continue to shift, global investors remain highly engaged in hedging interest rate risks. CME’s SOFR futures and options have become the primary instruments for managing short-term USD interest rate risk, attracting global institutional liquidity.
- Global Expansion: With non-U.S. ADV growing significantly, particularly in the APAC and EMEA regions, CME’s continued investment in international sales and distribution remains a cornerstone of its volume growth.
2. Capital Efficiency (Cross-Margining)
- FICC Cross-Margining: The expansion of cross-margining agreements with the Fixed Income Clearing Corporation (FICC) for U.S. Treasuries, now available to end-users, significantly lowers collateral requirements. This enhanced capital efficiency serves as a powerful incentive for market participants to centralize their clearing activities at CME.
3. Product Ecosystem Expansion
- Digital Asset Innovation: CME is aggressively expanding its digital asset portfolio. The company is set to launch Nasdaq CME Crypto Index futures on June 8, its first market-cap-weighted crypto product. Furthermore, the introduction of futures for emerging assets like Avalanche and Sui demonstrates its agility in responding to evolving asset classes.
- Credit and Commodity Specialization: The company continues to broaden its footprint in credit futures and specialty commodities (e.g., battery metals, carbon markets, and bioenergy). By offering more granular hedging contracts (such as weekly and daily expiring instruments), CME helps clients hedge risks with greater precision.
4. Operational Efficiency and Data Revenue
- Data Dominance: Market data revenue has reached record highs for multiple consecutive quarters, underscoring the inelastic demand for real-time market information. As institutional reliance on data-driven analysis grows, this segment is expected to remain a steady engine for top-line growth.
- Technology Investment: Despite occasional operational challenges, the company’s ongoing investment in cloud-based infrastructure and platform scalability is crucial for maintaining competitive advantages in trade execution and reliability.
Key Considerations for Investors
- Macro Environment: Variables such as the Fed’s interest rate path and geopolitical tensions—which drive volatility in energy and safe-haven assets—remain the primary external catalysts for trading volume.
- Capital Allocation: While profits remain strong, analysts continue to monitor how CME balances its robust dividend and share repurchase programs with long-term strategic investments to ensure sustained competitiveness.
The trajectory of CME Group’s earnings per share (EPS) over the next year is driven by a combination of market volatility, product diversification, and capital efficiency. Here is an analysis of the current market outlook:
EPS Forecast Overview
Consensus estimates from market analysts peg CME Group’s full-year 2026 EPS at approximately 12.27 USD.
- Near-term Outlook: While Q1 2026 EPS was robust at 3.36 USD (a 20% year-over-year increase), market expectations for subsequent quarters are more conservative, with Q2 2026 EPS projected around 2.87 USD.
- Long-term Growth: Analysts generally forecast a compound annual growth rate (CAGR) for EPS of 3.3% to 4.6% over the next three years.
Key Factors Influencing EPS Trajectory
1. Drivers of Potential Upside
- Product Innovation: The rollout of new instruments, such as the upcoming Nasdaq CME Crypto Index futures and expanded credit/battery metal derivatives, is expected to continue driving trading commission revenue.
- Capital Allocation: CME’s strong free cash flow supports its dividend and massive share repurchase programs. Reducing the share count provides a mathematical tailwind for EPS growth over time.
- Capital Efficiency (Cross-Margining): The expanded collaboration with the FICC for U.S. Treasuries is a strategic lever designed to increase clearing volumes by lowering capital costs for institutional clients.
2. Potential Downside Risks and Pressures
- Normalization of Trading Volume: The record-setting volumes in early 2026 were heavily fueled by acute global macroeconomic volatility. Should market turbulence subside, trading volumes may normalize, impacting clearing and transaction fee revenue.
- Operating Expense Inflation: To maintain technological superiority and satisfy evolving regulatory mandates, CME continues to increase investment in infrastructure and talent, which may apply short-term pressure on operating margins.
- Macro Uncertainty: Shifts in Federal Reserve interest rate policy, unexpected geopolitical events, and changing regulatory environments remain external variables that could disrupt market participation levels.
Summary
The market outlook for CME remains “cautiously optimistic.” While the company started 2026 with strong momentum, Wall Street’s expectations for EPS growth over the coming quarters have flattened, reflecting uncertainty regarding whether current record-breaking trading volumes are sustainable. Investor focus has shifted toward how effectively the company can use product innovation to offset volume volatility and how it will balance capital deployment to maintain its competitive moat.
Note: The projections above are based on current analyst consensus. Financial market forecasts are subject to high volatility, and actual results may vary significantly based on changing market conditions.
Below is a summary of the upside and downside potential based on current market data as of late May 2026:
1. Analyst Consensus and Price Targets
The Wall Street outlook is broadly bullish but cautious.
- Consensus Rating: Buy (with 60% of analysts rating it a Buy, 30% Neutral, and 10% Sell).
- Average Price Target: Approximately $304–$308.
- Target Range: Significant dispersion exists, ranging from a bearish $230–$266 to a bullish $353.
- Current Valuation: Trading near $291, the stock is viewed by some as modestly undervalued (about 5% upside based on fair value models), while others worry that the recent volatility-driven growth is already fully priced in.
2. Upside Potential (Bull Case)
- Resilience via Volatility: CME acts as a “toll booth” for financial markets. As long as geopolitical tensions (e.g., Middle East) and macroeconomic uncertainty persist, trading volume—the primary revenue engine—is likely to remain elevated.
- Strategic Product Expansion: New growth levers, such as the upcoming Nasdaq CME Crypto Index futures and expanded credit/battery metal derivatives, are diversifying revenue beyond traditional interest rate products.
- Capital Efficiency: The continued rollout of cross-margining agreements with the FICC for U.S. Treasuries is a strategic advantage that cements CME’s role for institutional clients, effectively acting as an incentive for volume growth.
3. Downside Risks (Bear Case)
- Margin Compression: Management has signaled that occupancy and technology expenses will ramp up in the second half of 2026, largely due to the opening of the new Dallas data center. This has led analysts (including those at BofA) to trim EPS forecasts and lower price targets.
- Normalization of Activity: A significant portion of Q1 2026’s record-breaking performance was driven by acute market volatility. Should the macroeconomic environment stabilize or bond yields decline (reducing the need for some hedging), trading volumes could revert to historical norms, potentially disappointing current high-growth expectations.
- Valuation Fatigue: The stock has seen strong returns over the past three years (total return of ~87%). Some valuation models, such as Discounted Cash Flow (DCF), suggest the stock could be trading above its intrinsic value, implying limited room for further multiple expansion.
Professional Summary
CME Group remains a “core” holding for many institutional portfolios due to its high operating margins (~70%+) and consistent shareholder returns (dividends and buybacks).
- For the Long-Term Investor: The current levels represent a relatively stable entry point, backed by a wide competitive moat.
- For the Short-Term/Tactical Investor: The stock faces a “show me” period in the second half of 2026. The market will be watching closely to see how effectively the company manages the cost structure of its new data center and whether trading volumes can sustain their Q1 momentum without excessive reliance on extreme market panic.
Disclaimer: This analysis is for informational purposes only and does not constitute financial advice. Investment decisions should be made based on your individual risk appetite and portfolio strategy.
Source:
- https://www.cmegroup.com/cn-t/newsletters/quarterly-equity-index-recap/2026-april-equity-index-recap.html
- https://finance.biggo.com.tw/quote/CME/financial
- https://www.cmegroup.com/media-room/press-releases/2026/4/22/cme_group_inc_reportsrecordrevenueadjustedoperatingincomeadjuste.html
- https://investor.cmegroup.com/static-files/fa9991f8-5049-4205-aac2-4ce5dba85daf
- https://www.investing.com/news/swot-analysis/cme-groups-swot-analysis-stock-shows-mixed-signals-amid-growth-93CH-4708146
- https://www.perplexity.ai/finance/CME/analysis
- https://www.investing.com/news/analyst-ratings/bofa-cuts-cme-group-stock-price-target-on-higher-costs-outlook-93CH-4634360
Back to CME page