Here is the summary of Uber’s latest quarterly financial results (Q1 2026):
Core Financial Performance
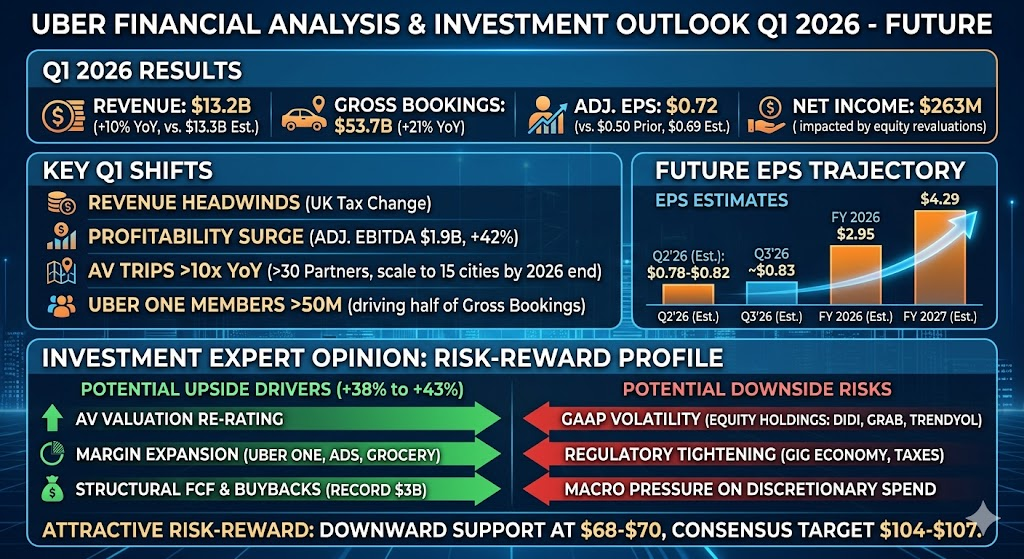
- Revenue: 13,203M, up 10% year-over-year on a constant currency basis, slightly missing Wall Street expectations of 13.3B.
- Gross Bookings: 53.7B, showing a robust year-over-year increase of 21%, indicating strong continued transactional demand across the platform.
- Adjusted EPS: 0.72 dollars, up from 0.50 dollars in the prior year period, beating the analyst consensus estimate of 0.69 dollars.
- Net Income: 263M, impacted by specific revaluations or investments, coming in below the market estimate of 1.487B.
Profitability & Operational Metrics
- Gross Margin: 45.03%
- Operating Margin: 14.56%
- Net Profit Margin: 1.99%
Market Reaction & Outlook
While revenue and net income fell short of some analysts’ most optimistic forecasts, the 21% surge in Gross Bookings coupled with the bottom-line EPS beat highlighted improving operational efficiency. Consequently, the market responded positively, with the stock driving significantly higher following the release.
Uber highlighted several critical structural shifts and operational milestones during its Q1 2026 earnings call, which explain why the market responded positively despite the slight top-line revenue miss:
1. Business Model Shifts and Tax Headwinds Pressuring Revenue
The growth rate of total revenue (10% on a constant currency basis) lagged significantly behind Gross Bookings growth (21%). This discrepancy was primarily caused by business model changes, specifically a 1B accounting headwind stemming from tax law adjustments in the UK. This artificially lowered the apparent revenue growth while leaving the underlying business expansion unaffected.
2. Profitability Structure Optimization: Non-GAAP Surges and Record Buybacks
While GAAP net income was heavily dragged down by a 1.5B paper loss from the revaluation of equity investments in Didi and Grab, non-GAAP operating profits jumped 42% year-over-year to 1.9B. Furthermore, the company generated a powerful 2.3B in free cash flow (FCF) for the quarter, demonstrating stellar cash conversion. This financial strength enabled Uber to return a record 3B to shareholders via stock buybacks during the period.
3. Autonomous Vehicle (AV) Ecosystem Experiences Explosive Growth
Autonomous Mobility Trips grew by over 10x year-over-year. Uber reaffirmed its asset-light, marketplace-integration strategy, now boasting over 30 global AV partners (including Waymo, Baidu, and WeRide). The company expects to scale AV services across up to 15 cities by the end of 2026, mitigating market concerns regarding potential displacement by vertically integrated competitors like Tesla.
4. Uber One Membership Crosses the 50 Million Milestone
Global Uber One membership officially surpassed the 50M mark. These highly engaged members now drive roughly half of the total Gross Bookings across both Mobility and Delivery. Data indicates that multi-platform users are expanding 1.5x faster than single-platform users, and member spend is roughly 3x higher than non-members, significantly reinforcing the platform’s competitive moat.
5. US Insurance Cost Efficiency Set to Fuel Demand
Management indicated that policy initiatives and technological enhancements are projected to save the US Mobility business hundreds of millions of dollars in insurance costs through 2026. Uber intends to strategically reinvest these premium savings into targeted price reductions, fueling trip volume growth in core metropolitan regions like Los Angeles, as well as suburban markets.
Uber provided optimistic guidance for Q2 2026 that exceeded market expectations, projecting Gross Bookings between 56.25B and 57.75B, representing a 18% to 22% year-over-year growth on a constant currency basis. Non-GAAP EPS is expected to reach 0.78 to 0.82 dollars, marking a substantial 31% to 38% increase year-over-year.
The core growth drivers sustaining this rapid momentum into the next quarter stem from four primary areas:
1. Delivery Revenue Engine Powered by Higher Average Order Value and Penetration
The Delivery segment’s revenue jumped 34% year-over-year to 5.07B, vastly outperforming market forecasts, and will continue to act as a key growth locomotive next quarter. This is heavily driven by the rapid expansion into new vertical sectors like Grocery & Retail. Recent partnerships with retail giants such as Ahold Delhaize and Stop & Shop have expanded the platform’s footprint across nearly 2,000 US stores, significantly boosting order frequency and average ticket sizes for non-restaurant deliveries.
2. Price and Demand Elasticity Unleashed in US Mobility
Following the improvement in US insurance cost structures and premium reductions, Uber will continue to pass these hundreds of millions of dollars in insurance savings back to consumers through highly competitive pricing strategies during the second quarter. This targeted price subsidization has already triggered notable order volume elasticity in core metropolitan areas like Los Angeles. This dynamic is expected to propagate to other major US cities and suburban markets in Q2, accelerating the rebound in ride-hailing trip counts.
3. Deeper Flywheel Effects from Uber One Membership
With global Uber One membership now surpassing 50M, members already contribute over 35% of total Mobility Gross Bookings in the United States. Because members scale their multi-platform spending 1.5x faster and generate 3x higher lifetime spend than non-members, this high-stickiness subscription model is establishing an exceptionally robust competitive moat for Q2. This ensures a dependable foundation of high-ticket, high-frequency recurring demand that insulates the platform from macroeconomic volatility.
4. International Expansion and Fleet Diversification
Beyond the accelerating deployment of Autonomous Vehicle (AV) fleets across multiple cities (such as expanding operations with unmanned permits via Nuro), Uber’s international expansion is receiving new tailwinds. This includes partnering with Santander in Europe to launch vehicle financing initiatives designed to expand driver capacity, alongside continued deep market penetration across the Asia-Pacific region (specifically Australia, Japan, and South Korea), delivering diversified geographical growth engines for both ride-hailing and delivery services.
Looking ahead over the next year (covering the remainder of FY 2026 through early 2027), Wall Street analysts and market consensus maintain a highly optimistic outlook for Uber’s earnings per share (EPS) trajectory, forecasting steady sequential growth.
Here is the key breakdown of data and structural drivers shaping Uber’s EPS direction over the next 12 months:
1. Consensus Earnings Estimates
- Q2 2026 Guidance: Management’s official guidance points to a Non-GAAP EPS of 0.78 to 0.82 dollars, while market expectations project Q3 EPS to climb further to approximately 0.83 dollars.
- Full-Year 2026 Consensus (FY 2026): Analysts currently project a consensus annual EPS of 2.95 dollars.
- Full-Year 2027 Consensus (FY 2027): The market consensus expects a sharp acceleration to 4.29 dollars, representing robust bottom-line expansion.
2. Operating Leverage and Margin Expansion Driving Bottom-Line Growth
The primary engine behind Uber’s EPS trajectory over the next year is the realization of powerful operating leverage. As the Mobility and Delivery segments scale globally, Uber is moving away from aggressive promotional spending toward optimization and high-margin monetization. The rapid maturation of high-margin revenue streams—such as retail media network advertising and grocery delivery—combined with optimized US driver insurance structures, will expand operating margins and allow earnings growth to comfortably outpace top-line revenue growth.
3. Share Buybacks Acting as an EPS Accelerator
Fueled by immense free cash flow generation (achieving 2.3B in Q1 alone), Uber is aggressively deploying capital toward share repurchases. Having returned 3B to shareholders this past quarter, the company is poised to utilize its recurring cash generation to steadily reduce its diluted share count over the coming year. This reduction in outstanding shares provides a strong structural tailwind that mathematically boosts EPS performance.
4. Potential GAAP Volatility from Equity Revaluations
Investors should differentiate between adjusted profitability and GAAP metrics over the next 12 months. Because Uber retains substantial equity stakes in global ride-hailing and logistics peers (including Didi, Grab, and Trendyol), market fluctuations in these public and private assets can induce sharp, non-cash paper gains or losses—much like the 1.5B markdown experienced in Q1. While these revaluations may introduce quarterly volatility to GAAP EPS, institutional investors will continue to anchor their valuations on Uber’s underlying Core Non-GAAP EPS and free cash flow generation.
Taking the current stock price of approximately 74 to 76 dollars as a baseline, the 12-month average consensus price target from major Wall Street firms (including Goldman Sachs, JPMorgan, and Wells Fargo) sits between 104 and 107 dollars. This implies a potential upside of roughly 38% to 43%, with the most bullish institutions (such as Evercore ISI) forecasting targets as high as 150 dollars. Conversely, the consensus downside support level anchors near 68 to 70 dollars.
Here is a detailed breakdown of the structural upside catalysts and downside risks:
Potential Upside Drivers: Sourcing the +40% Expansion Momentum
- Valuation Multiples Re-Rating via the AV Ecosystem Moat: The market previously discounted Uber’s valuation out of concern that vertically integrated Robotaxi models (such as Tesla’s) would disintermediate the business. However, a 10x year-over-year surge in autonomous trips alongside over 30 global partnerships validates Uber’s asset-light identity as the ultimate demand-and-routing marketplace. As AV commercialization scales through late 2026, its EV/EBITDA multiple (currently around 21x) has significant room to re-rate upward.
- High-Margin Monetization Flywheel: Uber One membership has cleared the 50M mark, with members exhibiting total lifetime spending roughly 3x that of non-members. As subscription stickiness deepens, higher-margin revenue streams—such as Retail Media Network advertising and grocery delivery verticals—will command a larger share of the revenue mix, driving margin expansion that outpaces top-line growth.
- Structural Capital Allocation Support: Generating 2.3B in quarterly free cash flow and executing a record 3B in share buybacks signals that management is aggressively utilizing capital to shrink the diluted share count. From a corporate finance standpoint, this provides an exceptionally strong structural floor for the equity while accelerating forward EPS.
Potential Downside Risks: Mapping the Defense Lower-Bound
- GAAP Earnings Volatility from Non-Cash Equity Revaluations: This represents the most prominent source of short-term headline noise. Uber maintains massive equity positions in international technology operations including Didi, Grab, and Trendyol. The 1.5B non-cash mark-to-market loss in Q1 underscores how broader market corrections or macroeconomic stress within emerging markets can depress GAAP net income, occasionally triggering irrational retail investor sell-offs.
- Regulatory Tightening and Global Tax Headwinds: The divergence between Gross Bookings expansion (21%) and revenue growth (10% on a constant currency basis) this quarter was heavily driven by a 1B accounting drag from tax restructuring in the UK. Any renewed regulatory push across the US or Europe aiming to reclassify gig-economy independent contractors as full employees or alter regional digital service tax structures could directly compress gross margins.
- Macroeconomic Pressure on Discretionary Spend: While current Gross Bookings remain robust at 21% growth, prolonged high interest rates or sticky inflation through the second half of 2026 could eventually strain consumer wallets. If macroeconomic conditions force users to cut back on discretionary premiums like meal delivery or premium rides, and Gross Bookings growth decelerates below 15%, analysts will downwardly revise their growth-multiple assumptions.
Investment Expert Conclusion
At present, Uber presents a highly asymmetrical risk-reward profile. The downside is insulated by aggressive, FCF-funded share repurchases and a sticky subscription base (suggesting roughly 10% downside risk), whereas the upside is heavily leveraged to the rapid commercialization of autonomous fleets and high-margin vertical migration (offering over 40% upside potential). While short-term GAAP earnings will remain noisy due to paper asset fluctuations, institutional positioning favors long-term structural margin expansion.
Source:
- https://www.futunn.com/stock/UBER-US/earnings
- https://www.itiger.com/hant/news/1172970800
- https://www.macromicro.me/stocks/info/UBER
- https://seekingalpha.com/news/4594631-whats-next-for-uber-after-q1-earnings-and-its-aggressive-autonomous-push
- https://www.fool.com/earnings/call-transcripts/2026/05/06/uber-uber-q1-2026-earnings-call-transcript/
- https://www.investing.com/news/company-news/uber-q1-2026-slides-profitability-surges-44-amid-revenue-headwinds-93CH-4663758
- https://seekingalpha.com/symbol/UBER/earnings/estimates
- https://www.marketbeat.com/instant-alerts/filing-uber-technologies-inc-uber-shares-sold-by-investment-house-llc-2026-05-20/
- https://simplywall.st/stocks/us/transportation/nyse-uber/uber-technologies/future
- https://www.investing.com/equities/uber-technologies-inc-consensus-estimates
- https://fintel.io/sfo/us/uber
- https://www.barchart.com/story/news/1975384/uber-stock-3-reasons-why-analysts-see-over-50-upside-potential
- https://investor.uber.com/news-events/news/press-release-details/2026/Uber-Announces-Results-for-First-Quarter-2026/default.aspx
- https://seekingalpha.com/article/4899379-uber-technologies-inc-uber-q1-2026-earnings-call-transcript
Back to Uber page