Here is the financial summary for TJX Companies (NYSE: TJX) covering their latest reported quarter, which is the fourth quarter of Fiscal Year 2026 (ended January 31, 2026).
Core Financial Metrics
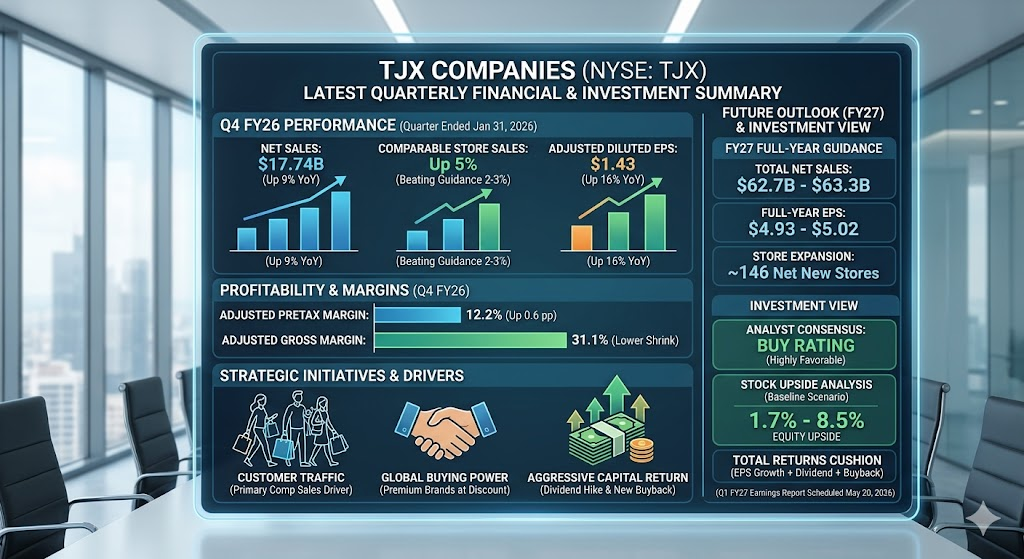
- Net Sales: $17.74B, up 9% year-over-year, beating market expectations of $17.36B.
- Comparable Store Sales: Increased by a strong 5%, outperforming the company’s prior guidance of 2% to 3%.
- Diluted EPS: Reported at $1.58, up 28% year-over-year. Excluding a $0.15 benefit from a litigation settlement, adjusted EPS was $1.43, up 16% and ahead of the $1.38 consensus estimate.
- Net Income: $1.8B for the quarter.
Profitability & Margins
- Pretax Profit Margin: Reached 13.5%, up 1.9 percentage points. Excluding the litigation settlement, the adjusted pretax profit margin was 12.2%, up 0.6 percentage points, exceeding internal targets.
- Gross Profit Margin: Stood at 30.9%, up 0.4 percentage points. The adjusted gross profit margin was 31.1%, primarily driven by lower shrink and merchandise cost favorability.
Segment Performance
- Marmaxx (US TJ Maxx & Marshalls): Sales reached $10.66B, up 7% year-over-year.
- HomeGoods (US): Sales reached $3.09B, up 8% year-over-year.
- TJX Canada: Maintained a steady segment profit margin of 13.0%.
- TJX International (Europe & Australia): Segment profit margin improved to 9.6%.
Cash Flow & Shareholder Returns
- Cash Flow: Generated $3.2B in operating cash flow during the quarter. For the full Fiscal Year 2026, the company generated $6.9B in operating cash flow, ending the year with $6.2B in cash.
- Capital Return: Returned $1.26B to shareholders this quarter through $784M in stock repurchases (5.1 million shares) and $472M in dividends.
- Dividend Hike & New Buyback: The Board announced plans to increase the quarterly dividend by 13% to $0.48 per share. It also approved a new $3.0B share repurchase program, with plans to buy back $2.5B to $2.75B of stock in Fiscal Year 2027.
Fiscal Year 2027 Full-Year Guidance
- Comparable Store Sales Growth: Expected to be 2% to 3%.
- Total Net Sales: Projected between $62.7B and $63.3B.
- Full-Year EPS: Guided in the range of $4.93 to $5.02.
- Store Expansion & Capex: Capital expenditures are budgeted at $2.2B to $2.3B, supporting the planned net addition of roughly 146 new stores alongside 540 store remodels and relocations.
Based on the latest earnings report and executive commentary, several critical operational and strategic shifts drove TJX’s stronger-than-expected performance:
1. Customer Traffic as the Core Growth Driver
The 5% increase in comparable store sales significantly outpaced the company’s guidance of 2% to 3%. The most critical qualitative shift here is that this growth was entirely driven by an increase in customer traffic (transaction volume) rather than higher average ticket prices. This indicates that mid-to-high income and value-seeking consumers are increasingly adapting off-price retail channels to stretch their budgets.
2. Profitability Structural Improvement: Shrink Control & Leverage
- Shrink Mitigation: Retail shrink (theft and inventory loss), which weighed heavily on the broader US retail sector in previous quarters, was materially stabilized and mitigated this quarter. This improvement served as a primary tailwind for the expansion of the adjusted gross profit margin to 31.1%.
- Expense Leverage: The top-line sales beat allowed TJX to achieve excellent operating leverage over fixed store payroll, logistics, and administrative expenses, further boosting bottom-line efficiency.
3. High-Quality Inventory Availability and Margin Strength
Management highlighted an incredibly robust buying environment. As traditional retailers and brands tightly managed their own inventory pipelines, TJX’s buying organization seized highly advantageous purchasing opportunities. This gave them access to ample premium apparel and home brands at deep discounts, keeping merchandise margins high while enhancing the “treasure hunt” experience for shoppers.
4. Aggressive Acceleration of Capital Returns
Demonstrating immense confidence in its ongoing cash generation, the board authorized two notable shifts in capital allocation:
- A 13% dividend hike, marking the 29th dividend increase for the company over the past 30 years.
- A brand new $3.0B share buyback authorization, with plans to deploy up to $2.75B of that capital in the upcoming Fiscal Year 2027 alone.
5. Margin Recovery in International Markets
While the domestic Marmaxx and HomeGoods divisions remained highly resilient, the international segment (TJX International covering Europe and Australia) staged a notable operational recovery. Previously hampered by severe inflationary headwinds and supply chain friction, the segment’s profit margin successfully rebounded to 9.6%, indicating that pricing strategies and localized operational efficiencies are back on track.
Looking ahead to the upcoming quarter (Q1 FY27) and the rest of the fiscal year, TJX’s growth momentum is driven by several key structural and operational catalysts:
1. Sustained Momentum from Consumer “Trading Down”
As macroeconomic uncertainty persists and inflation remains top-of-mind for households, the trend of middle- and high-income consumers “trading down” to off-price retail continues to gain traction. Management noted a strong start to the new fiscal year, indicating that the steady influx of new and returning value-seeking shoppers remains the foundational pillar supporting the company’s 2% to 3% comparable store sales growth guidance.
2. Aggressive Store Expansion and Remodeling Fleet
TJX continues to leverage its physical footprint to capture market share, maintaining that the brick-and-mortar “treasure hunt” experience cannot be easily replicated online.
- New Store Openings: Backed by a $2.2B to $2.3B capex budget for FY27, the company plans a net addition of roughly 146 new stores globally.
- Store Remodels: In parallel, TJX is executing over 540 store remodels and relocations. These upgrades optimize floor layouts, enhance merchandise presentation, and lift sales density per square foot.
3. Extreme Flexibility in Category Mix
As consumer spending patterns rotate away from big-ticket durable goods toward apparel, beauty, and smaller home accents, TJX’s flexible “open-to-buy” inventory model allows it to adjust store assortments within weeks. Management expects both Marmaxx and HomeGoods to capitalize on this agility, tilting inventory seamlessly toward whichever categories are seeing the highest immediate consumer velocity.
4. Amplified Marketing Initiatives
To sustain top-of-mind awareness during traditional retail transition periods, TJX plans to deploy aggressive, highly targeted marketing campaigns in the upcoming quarters. By heavily emphasizing its core value proposition—offering brand-name merchandise at 20% to 60% below department and specialty store regular prices—the company aims to convert sporadic holiday shoppers into loyal, frequent guests.
5. Tailwinds from Global Buying Power and International Recovery
- Buying Environment Advantage: Brand manufacturers and department stores are continuing to manage their stock levels tightly, creating an abundance of close-out and excess inventory. This environment gives TJX’s 1,300+ buying organization immense leverage to secure high-demand brands at favorable costs, protecting merchandise margins.
- International Consistency: Following a successful stabilization of profit margins in Europe and Australia, the international division (TK Maxx) enters the new quarter with optimized pricing tiers and leaner localized cost structures, poised to deliver steady incremental earnings.
Over the next year (Fiscal Year 2027, ending January 2027), TJX’s Earnings Per Share (EPS) is projected to sustain a solid and healthy growth trajectory. While management’s official guidance remains characteristically conservative, Wall Street consensus leans toward the upper end of expectations, driven by resilient consumer patterns.
The following breaks down the core figures and key variables shaping the EPS trajectory over the next 12 months:
EPS Guidance and Market Estimates
- Official Company Guidance: TJX projects full-year FY27 EPS to be between $4.93 and $5.02.
- Wall Street Consensus: Analysts are currently forecasting a full-year EPS of $5.00 to $5.06 (with a median around $5.03). This represents a 6.3% to 7% year-over-year growth rate compared to the adjusted FY26 EPS of $4.73.
- Upcoming Q1 FY27 Estimates: For the Q1 report scheduled on May 20, 2026, the company guided an EPS of $0.97 to $0.99, while the market consensus sits slightly higher at $1.00 (up from $0.92 in the prior year’s Q1).
Key Positive Catalysts Driving EPS Growth
- Top-Line Traffic and Operating Leverage: As lingering macroeconomic pressures cause households to budget more tightly, the “trading down” behavior from middle- and high-income demographics provides a steady stream of new customers. Meeting or exceeding the projected 2% to 3% comparable store sales growth will allow TJX to scale fixed costs efficiently, flowing straight to bottom-line EPS.
- Accelerated Share Buybacks: The board’s newly approved $3.0B stock repurchase program, with plans to deploy $2.5B to $2.75B during FY27, will systematically lower the company’s outstanding share count. This reduction acts as a direct mechanical lift to EPS throughout the year.
- Favorable Buying Environment: Because traditional retail channels are strictly controlling inventory, close-out availability from premium brands remains high. This allows TJX buyers to acquire high-demand products at steep discounts, insulating merchandise margins and neutralizing promotion-driven pricing pressures.
Potential Headwinds and Margin Constraints
- Persistent Store Wages and Logistics Costs: Rising retail wages across North America and sticky domestic supply chain costs remain the primary operational friction points. These ongoing expenses are the main reason management keeps its official guidance ranges guarded.
- Foreign Exchange Fluctuations: As a multinational operator, a continually strengthening US Dollar creates translational headwinds when consolidating revenues from TJX Canada and TJX International (Europe and Australia), which can modestly clip total reported EPS.
Overall, TJX’s EPS trajectory over the next year is expected to show steady, incremental expansion. Given the company’s historical pattern of under-promising and over-delivering, any upside surprise in customer traffic or inventory cost optimization during the upcoming May 20 earnings release could position full-year EPS to challenge or exceed the upper limit of the current guidance range.
A Resilient, Defense-First Core Asset
In an environment characterized by macroeconomic uncertainty and sticky living costs, TJX stands out as a high-quality defensive anchor with an exceptional operational moat. Wall Street consensus mirrors this view, maintaining a near-unanimous Buy rating.
1. Consumer Trading-Down as a Persistent Moat
As household budgets tighten, the “trading down” phenomenon is driving middle- and high-income demographics into off-price retail channels. TJX’s recent 5% comparable store sales growth was completely volume-driven (increased customer traffic) rather than price-driven. This structural shift provides a highly dependable demand cushion that protects the top line during economic slowdowns.
2. Buying Power and Inventory Control
With traditional retailers tightly managing inventory, close-out and excess merchandise remain abundant globally. This landscape grants TJX’s 1,300+ buying organization massive pricing leverage over vendors, shielding merchandise margins. Furthermore, the stabilization of retail shrink (inventory loss and theft) removes a major headwind, allowing the structural profitability to normalize.
3. Capital Returns Providing a Strong Cushion
TJX functions as a highly reliable capital return machine. The board recently implemented a 13% dividend hike and authorized a new $3.0B share buyback program (with plans to execute $2.5B to $2.75B this fiscal year). This continuous reduction in outstanding shares serves as a mechanical floor for earnings per share (EPS) and offers a major safety margin for long-term equity holders.
Stock Upside & Baseline Valuation Analysis
Following a sector-wide retail pullback over broader macroeconomic concerns, TJX’s stock has retraced from its previous highs of $156 to $160, closing at $147.43 (as of May 15, 2026). This correction has effectively cooled down previous valuation overextensions.
1. Wall Street Price Target
- Current Price: ~$147.43
- Consensus Average Target Price: ~$167.55, implying a baseline technical upside of around 13.6%, representing the stock’s fair-value trajectory under normal operating conditions.
2. Baseline Valuation Modeling (Strictly Adhering to Company Guidance)
Assuming the company experiences no unexpected earnings surprises and simply meets the official, conservative targets set by management for Fiscal Year 2027:
- Earnings Projection: Full-year FY27 EPS settles exactly at the guidance midpoint of $5.00 (official company guidance range is $4.93 to $5.02).
- Historical Multiples: TJX has historically traded at a rolling price-to-earnings (P/E) multiple between 28x and 30x.
- Price Trajectory Projections:
- At a conservative 28x P/E: The stock would value at $140.00, representing a modest downside risk of roughly 5% from current levels.
- At a historical average 30x P/E: The stock would value at $150.00, implying a minor, immediate upside of roughly 1.7%.
- At an elevated defensive premium of 32x P/E: If market volatility drives a flight to quality, pushing capital into safe-haven consumer staples, the stock would value at $160.00, implying an upside of around 8.5%.
Valuation Conclusion
Under a strict baseline lens that assumes no guidance outperformance, the current entry price of $147.43 already reflects the fair value of its projected FY27 earnings. Buying at this level means relying on steady, moderate expansion rather than explosive price appreciation, with the pure equity upside bounded between 1.7% and 8.5%.
Based on this conservative outlook, the primary appeal of TJX lies in its low volatility and steady total returns, which are expected to consist of single-digit baseline stock appreciation (1.7% to 8.5%) supplemented by a 1.3% dividend yield.
Source:
- https://www.marketbeat.com/stocks/NYSE/TJX/forecast/
- https://www.tikr.com/blog/tjx-stock-is-up-15-over-the-past-year-heres-the-path-to-168-by-2027
Back to TJX page