The history of Caterpillar (CAT) mirrors the evolution of global industry and infrastructure. From the early merger of tractor companies to its current status as a leader in AI and energy transition, its journey can be divided into five key stages:
1. Formation and Early Integration (1925–1944)
Context: Formed in 1925 through the merger of Holt Manufacturing Company and C. L. Best Tractor Co.
- Key Developments: During the Great Depression, CAT thrived by pioneering diesel engine technology (such as the D6100 launched in 1931).
- War Effort: During WWII, CAT produced over 50,000 tracked tractors for the Allies, playing a central role in constructing airfields and repairing critical infrastructure.
Core Products: Caterpillar Sixty tracked tractors, D6100 diesel engines (launched in 1931, establishing diesel leadership).
Core Strategy: Technical Standardization and Brand Consolidation. After merging rivals Holt and Best, CAT focused on high-efficiency diesel power and collaborated deeply with the U.S. military during WWII, building a brand image of “rugged durability.”
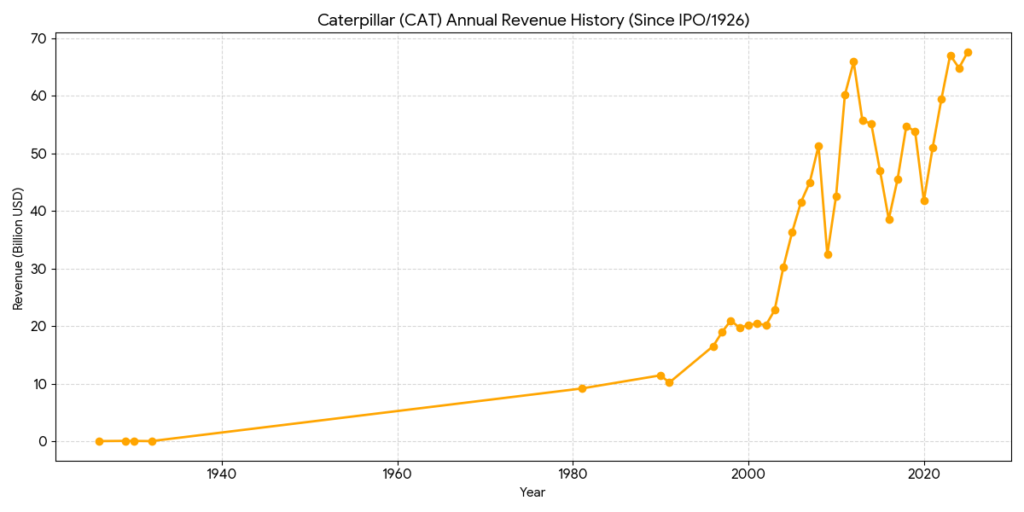
Revenue Level: Approximately 52 million USD in the late 1920s; dropped to 13 million USD during the Great Depression (1932).
2. Global Expansion and Post-War Boom (1945–1979)
Context: The post-war era triggered a massive demand for global reconstruction.
- Key Developments: Driven by the U.S. Interstate Highway System and overseas rebuilding, CAT expanded globally, establishing its first international subsidiary in the UK in 1950.
- Iconic Status: This period solidified CAT’s global dominance in excavators, bulldozers, and wheel loaders.
Core Products: D8 and D9 heavy bulldozers, motor graders, and the first wheel loader (944 Wheel Traxcavator).
Core Strategy: Globalization and Dealer Network. Capitalizing on post-war reconstruction, CAT established global subsidiaries and independent dealers, creating a competitive “moat” with the promise of “parts delivery within 48 hours.”
Revenue Level: Grew from the 100 million USD range post-war to approximately 7 billion USD by the late 1970s.
3. Diversification and Modernization (1980–1999)
Context: Faced a severe recession and intense competition from Japan’s Komatsu in the early 1980s.
- Key Developments: The company underwent a massive decentralization reform and invested 1.8 billion USD in a “Plant Modernization” program.
- Major Acquisitions: Acquired Solar Turbines in 1981 to enter the industrial gas turbine market, and Perkins Engines in 1998 to strengthen its lead in diesel engines.
Core Products: 300-series hydraulic excavators, Solar industrial gas turbines, and Perkins small-to-medium diesel engines.
Core Strategy: Automated Production and Diversification. Facing price competition from Komatsu, CAT invested 1.8 billion USD in factory modernization while diversifying into power and engine markets via acquisitions to hedge against construction cycles.
Revenue Level: Climbed steadily from 8 billion USD to approximately 20 billion USD by 1999.
4. Mining Peak and Service Transformation (2000–2019)
Context: The rise of emerging markets, particularly China, fueled a “golden decade” for mineral resources.
- Key Developments: In 2011, CAT acquired Bucyrus International for 8.8 billion USD, becoming the world’s largest mining equipment provider.
- Strategic Shift: Began a major push toward “Services Revenue” to reduce vulnerability to the cyclical nature of hardware sales.
Core Products: 797-series ultra-class mining trucks, Bucyrus surface mining equipment (e.g., electric rope shovels).
Core Strategy: Large-scale Acquisitions and Service Transformation. The 2011 acquisition of Bucyrus was a bet on the “Golden Decade” of commodities; meanwhile, “Services Revenue” became a core KPI to offset industry cyclicality.
Revenue Level: Fluctuated significantly between 20 billion and 65 billion USD, depending on the mining cycle.
5. Tech Transformation and Energy Revolution (2020–Present)
Context: Navigating climate change and the digital transformation era.
- Key Developments: CAT pivoted toward Autonomy, Electrification, and Digitalization. By 2026, the company achieved full automation for mining operations and commercialized hydrogen fuel cells.
- Current Status: Beyond machinery, CAT is now a critical provider for data center power solutions, utilizing AI-driven predictive maintenance to maximize customer efficiency.
Core Products: MineStar autonomous mining systems, hydrogen fuel cell backup power, and electric construction equipment (e.g., 301.9 electric mini-excavator).
Core Strategy: Autonomy (A), Electrification (E), and Digitalization (D). Transitioning into a high-margin tech-industrial stock, focusing on AI-driven predictive maintenance and data center power solutions to strengthen non-cyclical recurring income.
Revenue Level: Sustained between 50 billion and over 67 billion USD, with profit margins significantly improved by digital transformation.
Technical Competitive Analysis
In 2026, the core competition for Caterpillar (CAT) has shifted from traditional mechanical structures to Industrial AI, Autonomous Systems, and New Energy Power. Below is a technical comparison between CAT and its primary rivals, Komatsu and John Deere.
1. Autonomy and Automation Technology
CAT currently holds a leading position in autonomy, especially following its technical breakthroughs showcased at CES 2026.
- Caterpillar (Cat MineStar & Command):
- Technical Features: Beyond mining, CAT officially expanded into construction in 2026, launching five autonomous machines including dozers, loaders, and excavators. The system is powered by the NVIDIA Jetson Thor platform, enabling real-time AI inference at the edge.
- Competitive Edge: With the world’s largest autonomous hauling fleet (over 2000 vehicles), CAT’s accumulated data far exceeds its competitors.
- Komatsu (iMC 2.0):
- Technical Features: Focuses on Intelligent Machine Control (iMC), featuring automatic blade positioning and excavation depth control.
- Competition: Komatsu excels in job site digitalization (Smart Construction), providing precise terrain simulation and project progress tracking.
- John Deere (SmartGrade):
- Technical Features: Factory-integrated 3D grade control with precision up to ±1 inch. Its agricultural background gives it a competitive edge in GPS navigation and path optimization.
2. Industrial AI and Digital Transformation
This serves as the key differentiator between CAT and its peers in 2026.
| Technical Metric | Caterpillar | Komatsu | John Deere |
| AI Assistant | Cat AI Assistant: Uses voice/vision interaction to set operational limits (e.g., ceiling heights). | Komtrax AI: Focuses on predictive maintenance and fuel efficiency analytics. | Operations Center: Focuses on cloud integration of agriculture and construction data. |
| Processing Platform | NVIDIA Thor (Edge AI) | Proprietary Controllers | Proprietary & Cloud Collaboration |
| Digital Twin | Fully applied in product design and site simulation. | Focuses on total site digitalization (Dantotsu). | Emphasizes precision operations and remote monitoring. |
3. New Energy and Power Technology
- Caterpillar:
- Hydrogen: Collaborated with Microsoft and Ballard to successfully demonstrate a 1.5MW hydrogen fuel cell backup power system for data centers, capable of stable operation in extreme climates.
- Electrification: Launched the 793 all-electric mining truck prototype, currently undergoing validation with mining customers via the “Early Learner” program.
- Volvo CE: Leads in small-to-medium electric equipment, with a mature lineup of commercial electric excavators and haulers.
- Komatsu: Partnered with Pronto to accelerate the deployment of autonomous electric trucks in quarries.
Technical Summary: CAT’s Competitive Moat
- Data Closed-Loop: CAT leverages its massive installed base to collect vast amounts of data via VisionLink to optimize its AI models, creating a high barrier to entry.
- Deep Hardware-Software Integration: CAT insists on OEM-integrated solutions rather than aftermarket retrofits, ensuring high stability and low latency between autonomous systems and machine hardware.
- Edge Computing Power: The deep partnership with NVIDIA in 2026 allows CAT machines to maintain independent AI decision-making capabilities even at remote job sites without network connectivity.
1. Five-Year P/E Ratio Trend Comparison
Between 2021 and 2025, the valuation trends for CAT and DE remained relatively close, while Komatsu consistently maintained a lower valuation multiple. This reflects the different risk pricing the market assigns to Japanese versus American industrial stocks.
| Year | Caterpillar (CAT) | John Deere (DE) | Komatsu (KMTUY) |
| 2021 | 21.7x | 19.5x | ~11.2x |
| 2022 | 16.9x | 19.4x | ~9.8x |
| 2023 | 16.5x | 10.5x | 9.4x |
| 2024 | 16.4x | 13.5x | ~10.1x |
| 2025 | 34.6x | 28.4x | ~12.5x |
| Current (2026/02) | 36.7x | 30.6x | 13.8x |
Analytical Perspectives:
- Valuation Expansion: From 2025 to early 2026, CAT’s P/E surged significantly above 36x. This is primarily driven by high market expectations for AI data center power demand and infrastructure renewals, rather than pure earnings growth alone.
- DE’s Volatility: John Deere’s P/E dipped to a low of 10.5x in 2023 due to a downturn in the agricultural cycle, followed by a valuation recovery led by smart farming technology.
- Komatsu’s Discount: Komatsu has long traded between 10x-14x, reflecting its high sensitivity to the Japanese Yen exchange rate and lower ROE compared to CAT.
2. Core Financial Ratio Analysis (2023-2025 Average)
While all three companies operate in the heavy machinery sector, their profit models and financial structures differ significantly.
| Financial Metric | Caterpillar (CAT) | John Deere (DE) | Komatsu (KMTUY) |
| ROE (Return on Equity) | 53.0% | 38.5% | 14.1% |
| Net Margin | 15.0% | 13.8% | 10.2% |
| Asset Turnover | 0.77 | 0.65 | 0.58 |
| Debt-to-Equity (D/E) | 2.03 | 2.55 | 0.45 |
| Dividend Yield | 0.88% | 1.15% | 3.20% |
Key Insights:
- Profitability King: CAT boasts the highest ROE (53%) and Net Margin, demonstrating the success of its brand premium and transition toward service-based revenue (Parts & Services).
- Leverage Utilization: CAT and DE utilize higher financial leverage to amplify returns, whereas Komatsu maintains the most conservative financial structure (D/E of only 0.45), which inherently limits its ROE performance.
- Operational Efficiency: CAT’s superior asset turnover reflects the advantages of its Dealer Network in inventory management and product delivery.
3. Technical Analysis and Market Pricing
- Reasons for CAT’s Premium: The market grants CAT the highest P/E because its market share in “Energy Transition” and “Data Center Backup Power” far exceeds that of its rivals.
- DE’s Transformation Risk: DE is striving to become a “software company” (autonomous farm machinery). If software subscription revenue increases as a percentage of total sales, its P/E may further decouple from traditional industrial stocks.
- Komatsu’s Defensiveness: A higher dividend yield and extremely low debt provide Komatsu with better downside protection during market volatility.
Source:
- https://www.cat.com/zh_TW/company.html
- https://www.caterpillar.com/en/news/corporate-press-releases/h/cat-ces-2026.html
- https://www.forbes.com/companies/caterpillar/
Back to Caterpillar page