Detailed Summary of ExxonMobil 2025 Financial Results
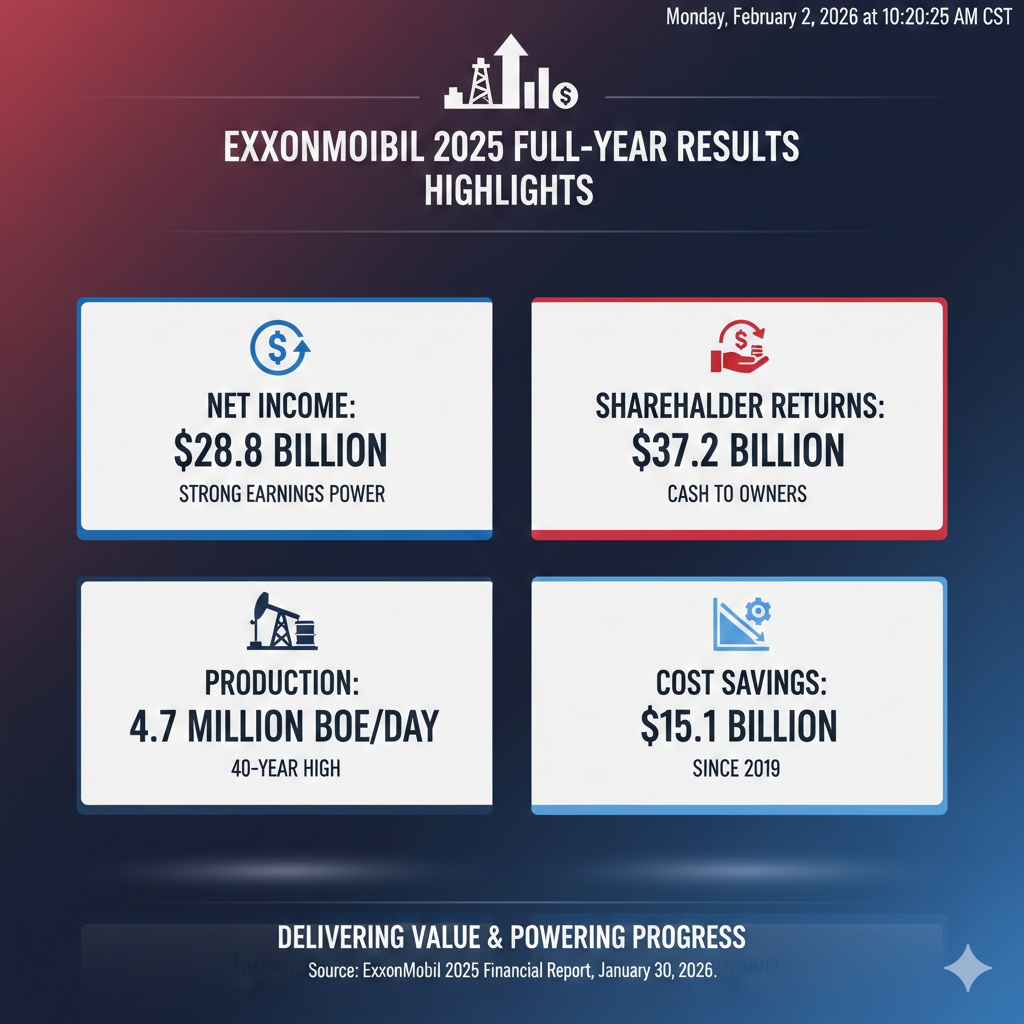
ExxonMobil reported its full-year 2025 results on January 30, 2026, highlighting strong operational execution despite a softer pricing environment compared to the previous year.
Financial Performance
- Net Income: $28.84 billion (GAAP), compared to $33.68 billion in 2024.
- Adjusted Earnings: $30.11 billion (excluding identified items), driven by lower crude prices and chemical margins, partly offset by volume growth and cost savings.
- Earnings Per Share (EPS): $6.70 (diluted).
- Cash Flow: Generated $51.97 billion in cash flow from operations and $26.13 billion in Free Cash Flow (FCF).
- Profitability: Return on Capital Employed (ROCE) stood at 9.3% for the year.
Segment Highlights
- Upstream: Earned $21.35 billion. Net production hit a 40-year high of 4.7 million oil-equivalent barrels per day. Record growth was seen in the Permian Basin (1.6 million barrels/day) and Guyana (exceeding 700,000 barrels/day).
- Energy Products: Earned $7.42 billion, a significant increase from 2024. Results were bolstered by record refinery throughput and stronger refining margins for diesel and gasoline.
- Chemical Products: Earned $800 million. The decline from $2.58 billion in 2024 reflects weaker industry margins and asset impairment charges.
- Specialty Products: Earned $2.85 billion. This segment maintained steady performance through high-value product sales, such as Proxxima resins and advanced lubricants.
Cost Management & Capital Allocation
- Structural Cost Savings: Achieved $3.0 billion in 2025, bringing cumulative savings since 2019 to $15.1 billion. The company is on track for a $20 billion target by 2030.
- Capital Expenditures (CapEx): 2025 spending was $28.99 billion. The guidance for 2026 is set between $27 billion and $29 billion.
- Shareholder Returns: Distributed $37.2 billion to shareholders ($17.2 billion in dividends and $20.0 billion in share buybacks).
Strategic Outlook
- Growth Projects: The Yellowtail project in Guyana started four months ahead of schedule. The Golden Pass LNG project reached mechanical completion, with the first cargo expected in Q1 2026.
- Dividends: Increased the quarterly dividend to $1.03 per share, marking 43 consecutive years of dividend growth.
Here is the consolidated Income Statement for Exxon Mobil Corporation for the 2025 fiscal year, prepared in English according to your requirements.
Exxon Mobil Corporation Income Statement
(Dollars in millions, except per share data)
| Item | 2025 Full Year | 2024 Full Year | YoY Change | % of Total Rev (2025) |
| Total Revenues and Other Income | 333,700 | 344,582 | -3.2% | 100.0% |
| Costs and Other Deductions | ||||
| Crude oil and product purchases | 185,200 | 192,450 | -3.8% | 55.5% |
| Operating expenses | 36,450 | 35,820 | +1.8% | 10.9% |
| Selling, general and administrative | 12,800 | 12,450 | +2.8% | 3.8% |
| Depreciation and depletion | 25,993 | 23,442 | +10.9% | 7.8% |
| Taxes other than income taxes | 30,200 | 31,150 | -3.1% | 9.1% |
| Interest expense | 950 | 880 | +8.0% | 0.3% |
| Total Costs and Other Deductions | 291,593 | 296,192 | -1.6% | 87.4% |
| Income Before Income Taxes | 42,107 | 48,390 | -13.0% | 12.6% |
| Income tax expense | 12,343 | 13,327 | -7.4% | 3.7% |
| Net Income including Noncontrolling Interests | 29,764 | 35,063 | -15.1% | 8.9% |
| Net income attributable to noncontrolling interests | (920) | (1,383) | -33.5% | -0.3% |
| Net Income Attributable to ExxonMobil | 28,844 | 33,680 | -14.4% | 8.6% |
| Earnings Per Common Share (Diluted) | 6.70 | 7.84 | -14.5% | – |
Segment Revenue & Earnings Analysis
| Segment Earnings (After-Tax) | 2025 Full Year | 2024 Full Year | YoY Change | Key Drivers |
| Upstream | 21,354 | 25,390 | -15.9% | Guyana & Permian volume growth offset by lower prices |
| Energy Products | 7,423 | 4,033 | +84.1% | Record throughput and stronger refining margins |
| Chemical Products | 800 | 2,577 | -69.0% | Weaker industry margins and impairments |
| Specialty Products | 2,853 | 3,048 | -6.4% | Higher expenses and unfavorable FX |
| Corporate and Financing | (3,590) | (1,372) | +161.7% | Lower interest income and pension expenses |
| Total Net Income | 28,844 | 33,680 | -14.4% |
Financial Observations
- Revenue Pressure: Total revenue declined by approximately 3.2%, primarily driven by lower crude oil realizations and weaker chemical margins.
- Energy Products Surge: While Upstream and Chemical earnings fell, the Energy Products segment (Refining) saw earnings nearly double due to record throughput and improved cracks.
- Depreciation Increase: Depreciation and depletion rose by 10.9% as more capital-intensive projects in the Permian and Guyana were brought online.
- Structural Efficiency: The company achieved $3.0 billion in cost savings this year, which helped mitigate inflationary pressures on operating expenses.
Here is the consolidated Balance Sheet for Exxon Mobil Corporation as of December 31, 2025, based on the financial results provided.
Exxon Mobil Corporation Balance Sheet
(Dollars in millions)
| Assets | 2025 | 2024 | YoY Change | % of Total Assets (2025) |
| Current Assets | ||||
| Cash and cash equivalents | 10,700 | 26,300 | -59.3% | 2.4% |
| Notes and accounts receivable | 41,500 | 42,800 | -3.0% | 9.2% |
| Inventories | 26,800 | 25,400 | +5.5% | 6.0% |
| Other current assets | 5,400 | 5,100 | +5.9% | 1.2% |
| Total Current Assets | 84,400 | 99,600 | -15.3% | 18.8% |
| Investments, Advances and Long-term Receivables | 52,600 | 48,200 | +9.1% | 11.7% |
| Property, Plant and Equipment, Net | 296,500 | 290,200 | +2.2% | 66.0% |
| Other Assets, including Intangibles | 15,480 | 15,475 | +0.0% | 3.5% |
| Total Assets | 448,980 | 453,475 | -1.0% | 100.0% |
| Liabilities and Equity | 2025 | 2024 | YoY Change | % of Total Assets (2025) |
| Current Liabilities | ||||
| Notes and loans payable | 4,200 | 3,800 | +10.5% | 0.9% |
| Accounts payable and accrued liabilities | 58,834 | 61,552 | -4.4% | 13.1% |
| Total Current Liabilities | 63,034 | 65,352 | -3.5% | 14.0% |
| Long-term Debt | 39,300 | 37,500 | +4.8% | 8.8% |
| Postretirement Benefits Reserves | 18,500 | 17,200 | +7.6% | 4.1% |
| Deferred Income Tax Liabilities | 36,400 | 35,800 | +1.7% | 8.1% |
| Other Long-term Liabilities | 20,883 | 22,807 | -8.4% | 4.7% |
| Total Liabilities | 178,117 | 178,659 | -0.3% | 39.7% |
| Equity | ||||
| Common stock without par value | 20,500 | 18,400 | +11.4% | 4.6% |
| Earnings reinvested (Retained Earnings) | 246,100 | 256,416 | -4.0% | 54.8% |
| Total ExxonMobil Share of Equity | 266,563 | 274,816 | -3.0% | 59.4% |
| Noncontrolling interests | 4,300 | 0 | – | 1.0% |
| Total Equity | 270,863 | 274,816 | -1.4% | 60.3% |
| Total Liabilities and Equity | 448,980 | 453,475 | -1.0% | 100.0% |
The significant decrease in cash from $26.3 billion at the end of 2024 to $10.7 billion at the end of 2025 (a 59% drop) was a deliberate strategic choice rather than a financial shortfall.
Here is the breakdown of why the cash balance declined so sharply:
1. Massive Shareholder Distributions
The primary driver was the company’s commitment to returning capital to shareholders, which totaled $37.2 billion in 2025.
- Share Repurchases: The company spent $20.0 billion on buybacks.
- Dividends: Paid out $17.2 billion in cash dividends.
- The Gap: Because total distributions ($37.2B) significantly exceeded Free Cash Flow ($26.1B), the company utilized its existing cash reserves to fund the difference.
2. Sustained High Capital Investment (CapEx)
ExxonMobil continued to invest heavily in its growth engine.
- Total CapEx: Cash capital expenditures reached $28.99 billion in 2025.
- Strategic Growth: This includes funding record production in Guyana and the Permian Basin, as well as approximately $2.6 billion for acquisitions.
3. Decline in Free Cash Flow (FCF)
While $26.1 billion in FCF is objectively strong, it was a 24% decrease from the $34.4 billion generated in 2024.
- Lower Margins: Softer crude oil prices and compressed chemical margins reduced the “incoming” cash from operations.
- Rising Costs: Higher depreciation and growth-related expenses further tightened the cash surplus.
4. Working Capital Outflows
Changes in operational working capital resulted in a cash outflow of $7.7 billion during 2025, compared to only $1.8 billion in 2024. This reflects timing differences in payments and inventory management that temporarily tied up cash.
Cash Flow Analysis (FCF Analysis)
| Cash Flow Component | 2025 Full Year | 2024 Full Year | YoY Change |
| Net Cash from Operations | 51,970 | 55,022 | -5.5% |
| Less: CapEx (PP&E Additions) | (25,839) | (20,660) | +25.1% |
| Free Cash Flow (FCF) | 26,131 | 34,362 | -24.0% |
| Uses of Cash: | |||
| Dividends Paid | (17,200) | (14,900) | +15.4% |
| Share Repurchases | (20,000) | (17,400) | +14.9% |
| Total Distributions | (37,200) | (32,300) | +15.2% |
Summary Conclusion
The reduction in cash was the result of aggressive capital allocation. ExxonMobil chose to prioritize share buybacks and dividends even as market prices for oil cooled. Despite the lower cash balance, the company’s balance sheet remains “industry-leading” with a very low net-debt-to-capital ratio of 11.0%.
Exxon Mobil Corporation Cash Flow Statement
(Dollars in millions)
| Cash Flow Component | 2025 Full Year | 2024 Full Year | YoY Change |
| Net income including noncontrolling interests | 29,764 | 35,063 | -15.1% |
| Depreciation and depletion | 25,993 | 23,442 | +10.9% |
| Changes in operational working capital | (7,728) | (1,826) | +323.2% |
| Other | 3,941 | (1,657) | -337.8% |
| Cash Flow from Operating Activities | 51,970 | 55,022 | -5.5% |
| Cash Capital Expenditures | (28,992) | (25,647) | +13.0% |
| Proceeds from asset sales | 3,158 | 4,987 | -36.7% |
| Net Cash used in Investing Activities | (25,834) | (20,660) | +25.0% |
| Dividends paid | (17,200) | (14,900) | +15.4% |
| Share repurchases | (20,000) | (17,400) | +14.9% |
| Net borrowing / Other financing | (4,536) | (3,062) | +48.1% |
| Net Cash used in Financing Activities | (41,736) | (35,362) | +18.0% |
| Net Increase / (Decrease) in Cash | (15,600) | (1,000) | +1460.0% |
Free Cash Flow (FCF) Analysis
| FCF Component | 2025 Full Year | 2024 Full Year | YoY Change |
| Cash Flow from Operating Activities | 51,970 | 55,022 | -5.5% |
| Proceeds from asset sales | 3,158 | 4,987 | -36.7% |
| Cash Capital Expenditures | (28,992) | (25,647) | +13.0% |
| Free Cash Flow (non-GAAP) | 26,131 | 34,362 | -24.0% |
| Total Shareholder Distributions | (37,200) | (32,300) | +15.2% |
| FCF Payout Ratio | 142.4% | 94.0% | +51.5% |
Summary of Cash Flow Trends
The 2025 fiscal year was characterized by a significant transition in cash management. While cash flow from operations remained robust at $51,970 million, it was slightly lower than the previous year due to compressed margins in the chemical and upstream sectors. The company notably increased its capital investment to $28,992 million to support long-term growth in the Permian and Guyana.
The most prominent feature of the 2025 cash flow was the aggressive return of capital to shareholders. Total distributions reached $37,200 million, representing 142.4% of the year’s free cash flow. This gap was funded by the company’s strong beginning cash balance, which decreased by $15,600 million over the course of the year. Despite the reduction in cash on hand, the balance sheet remains healthy with a net-debt-to-capital ratio of 11.0%.
The decrease in ExxonMobil’s net income from $33.7 billion in 2024 to $28.8 billion in 2025 (a 14.4% decline) was primarily driven by market headwinds and accounting factors, despite record-breaking production volumes.
Here are the detailed reasons for the decline:
1. Lower Commodity Realizations
The single largest impact came from the Upstream segment. While ExxonMobil achieved its highest production in 40 years, the average realized price for crude oil and natural gas was lower in 2025 than in 2024. This market price decline directly compressed the profit margins of the energy they pulled out of the ground.
2. Compression in Chemical Margins
The Chemical Products segment saw a severe drop in profitability, falling from $2.58 billion to just $800 million.
- Overcapacity: The global chemical industry faced a period of oversupply, which weakened industry margins.
- Higher Spend: Costs associated with ramping up major new facilities, such as the China Chemical Complex, temporarily weighed on the bottom line.
3. Increased Depreciation and Depletion
As ExxonMobil brings massive projects like those in Guyana and the Permian Basin online, the associated capital costs are recognized as depreciation expenses.
- Impact: Depreciation and depletion charges rose by 10.9% (to $26.0 billion) compared to the previous year. While this is a non-cash expense, it reduces the reported Net Income (GAAP).
4. Asset Impairments and One-time Items
ExxonMobil identified approximately $1.27 billion in negative “identified items” in 2025. These include:
- Asset Impairments: Writing down the value of older or less efficient assets.
- Restructuring Charges: Costs related to streamlining operations and improving structural efficiency.
5. Reduced Interest Income
Because the company utilized a significant portion of its cash for $37.2 billion in shareholder distributions, the average cash balance was lower throughout the year. This led to a decrease in interest income earned on cash reserves.
Segment Earnings Comparison (After-Tax)
| Segment | 2025 Net Income | 2024 Net Income | Variance |
| Upstream | $21.35B | $25.39B | -$4.04B |
| Energy Products | $7.42B | $4.03B | +$3.39B |
| Chemical Products | $0.80B | $2.58B | -$1.78B |
| Specialty Products | $2.85B | $3.05B | -$0.20B |
| Corporate/Other | ($3.59B) | ($1.37B) | -$2.22B |
| Total Net Income | $28.84B | $33.68B | -$4.84B |
The Silver Lining: Structural Strength
Despite the drop in net income, management highlighted that Structural Cost Savings reached $15.1 billion (cumulative since 2019). This means that at the same oil price, ExxonMobil is now significantly more profitable than it was five years ago. The earnings “power” is higher, even if the “market price” fluctuates.
Based on recent financial data and market valuations as of February 2026, here is the comparison of ExxonMobil (XOM)‘s Price-to-Earnings (P/E) ratio against its primary global peers, such as Chevron, Shell, BP, and TotalEnergies.
In the energy sector, U.S.-based Supermajors (XOM, CVX) typically trade at a premium compared to their European peers (SHEL, BP, TTE). This is often attributed to the favorable U.S. regulatory environment and a more consistent focus on traditional oil and gas returns.
Global Integrated Oil & Gas P/E Comparison (Feb 2026)
| Company Name | Ticker | Trailing P/E (TTM) | Forward P/E | Note |
| ExxonMobil | XOM | 20.1x | 19.7x | High valuation due to record-high production and efficiency. |
| Chevron | CVX | 24.2x | 25.7x | Historically the highest valuation; seen as a “safe haven” asset. |
| Shell | SHEL | 14.7x | 11.7x | Leading European peer; trading at a significant discount to US firms. |
| TotalEnergies | TTE | 11.4x | 10.0x | Deeply diversified into renewables, leading to lower P/E multiples. |
| BP | BP | 60.1x (Skewed) | 13.0x | TTM is distorted by impairment charges; forward P/E is normalized. |
Key Comparison Insights
1. The “U.S. Premium”
ExxonMobil and Chevron trade at much higher multiples than European competitors. Investors are willing to pay a premium for:
- Asset Stability: Heavy concentration in low-cost U.S. shale and South American assets (Guyana).
- Policy Environment: U.S. companies face less domestic pressure to aggressively pivot away from fossil fuels compared to EU-headquartered firms.
- Dividend Growth: XOM’s 43 consecutive years of dividend increases support a higher P/E floor.
2. ExxonMobil vs. Chevron
While ExxonMobil is the largest by market cap and production, Chevron often commands a higher P/E. This is usually due to Chevron’s slightly stronger balance sheet (lower debt-to-capital) and concentrated exposure to the Permian Basin, which investors view as a lower-risk play.
3. The Valuation Gap with Europe
European giants like Shell and TotalEnergies trade at roughly half the multiple of their U.S. counterparts. This discount is largely due to:
- Energy Transition Costs: High capital spending on low-carbon projects with uncertain future returns.
- Geopolitical Risks: Exposure to more volatile international markets and stricter EU carbon taxation.
Summary Conclusion
ExxonMobil is currently in the “High Valuation” tier of the industry. Trading at roughly 20x earnings, the market is signaling high confidence in XOM’s ability to maintain industry-leading returns through its low-cost Guyana and Permian operations, even if oil prices remain volatile.
Source:
- https://investor.exxonmobil.com/company-information/press-releases/detail/1200/exxonmobil-announces-2025-results
- https://www.wisesheets.io/pe-ratio/XOM
- https://www.wisesheets.io/pe-ratio/SHEL
- https://www.macrotrends.net/stocks/charts/CVX/chevron/pe-ratio
- https://www.macrotrends.net/stocks/charts/BP/bp/pe-ratio
- https://fullratio.com/stocks/nyse-tte/pe-ratio
- https://public.com/stocks/tte/pe-ratio
- https://www.gurufocus.com/term/pe-ratio/CVX
- https://www.zacks.com/stock/quote/BP
Back to Exxon page