FY2026 Q3 Performance Summary
-
Revenue growth – FY2026 Q3 revenue reached $57.0B, up 62% year-over-year and 22% quarter-over-quarter, reflecting continued strength in AI infrastructure demand.
-
Data Center momentum – Data Center revenue grew 66% year-over-year, driven by broad adoption of the Blackwell architecture across hyperscalers, enterprises, and sovereign customers.
-
System-level adoption – Strong growth in both compute and networking revenues, led by NVLink and AI networking, signals a shift from discrete GPU purchases to full-stack AI system deployments.
-
Margin trajectory – Gross margin declined year-over-year due to the transition from Hopper to full-scale Blackwell data center solutions, but improved sequentially as Blackwell volumes ramped and cost structure normalized.
-
Cash flow strength – Operating cash flow totaled $23.8B in the quarter, reinforcing NVIDIA’s ability to fund aggressive R&D, secure long-lead supply, and scale infrastructure.
-
Capital returns – The company returned $12.7B to shareholders via share repurchases and dividends while maintaining a strong balance sheet.
-
Forward outlook – Q4 FY2026 revenue guidance of approximately $65.0B indicates sustained momentum and no near-term signs of demand deceleration.

Data Center Dominance: The Primary Catalyst for NVIDIA’s FY2026 Q3 Growth
The Data Center segment remains the primary growth engine, with its revenue share surging to nearly 90%. This dominance highlights the massive market demand for the Blackwell architecture and large-scale AI infrastructure.
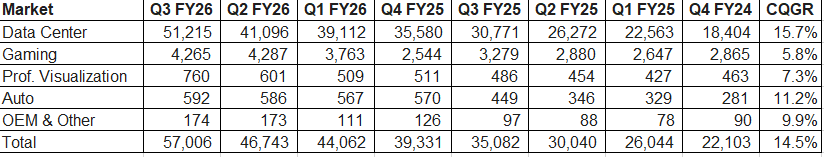

Explosive Demand in Data Center Business: The Data Center segment remains the primary engine driving overall revenue growth.
-
Computing Platform Demand: Data Center compute revenue reached $43.0B this quarter. This is primarily attributed to sustained strong demand for the NVIDIA Hopper GPU platform (such as H100) and the commencement of production shipments for the new Blackwell architecture.
-
Platform Transition: The market is undergoing a platform shift from general-purpose computing to accelerated computing and AI models, driving an annual AI infrastructure build opportunity valued at $3 trillion to $4 trillion.
-
Blackwell Product Cycle: Blackwell Ultra has become the leading architecture across various customer segments—including cloud service providers, enterprises, and sovereign AI—and is rapidly scaling across all customer categories.
Other Income Surge Driven by Investment Gains and Higher Interest Income
For fiscal year 2026 third quarter, Other income, net increased significantly to $1.363 billion, compared with only $36 million in the same period last year. The primary drivers were as follows:
Significant increase in investment gains
The main contributor to Other income this quarter was net gains from equity securities. These gains reflect fair value changes in the company’s investments in both non-marketable (private) equity securities and publicly traded equity securities.
Growth in interest income
As cash, cash equivalents, and marketable securities increased to approximately $34.8 billion at quarter-end, interest income also rose year over year, providing an additional positive contribution to Other income.
Detailed composition
According to the Form 10-Q, the $1.363 billion in Other income, net was primarily composed of:
-
$1,252 million from net gains on non-marketable and publicly held equity securities
-
$111 million from other items, including net interest income (interest income less interest expense)
FY26Q3 Balance Sheet

Inventory Expansion Driven by Blackwell Production Ramp and Data Center Demand
Based on NVIDIA’s fiscal year 2026 third-quarter Form 10-Q and investor presentation, inventories increased significantly to $19.784 billion, representing an approximately 96% increase from $10.080 billion at the beginning of the fiscal year. The primary drivers are as follows:
-
Blackwell production ramp and inventory build
The company is in a critical transition phase from the Hopper platform to the Blackwell full-scale data center solution. The sharp increase in inventories reflects component procurement and finished-goods build to support strong anticipated demand for next-generation Blackwell products, including Blackwell Ultra. -
Supply chain strategy and long-term supply agreements
To secure stable access to key components and shorten delivery lead times, NVIDIA increased purchasing commitments and inventory levels with leading long-term suppliers. This strategy is also reflected in the cash flow statement, which shows higher cash usage for inventory purchases and prepaid supply arrangements. -
Supporting explosive data center demand
Data center revenue continued to grow at an exceptionally high rate during the quarter. To support large-scale system deployments—such as full-stack AI infrastructure deliveries—NVIDIA must maintain higher inventory levels to meet orders from hyperscalers and enterprise customers. -
Rising product complexity and higher BOM value
As NVIDIA shifts from selling individual GPUs to delivering integrated systems that include networking, software, and compute modules, overall product complexity and bill-of-materials (BOM) value have increased. This naturally results in higher inventory balances on the balance sheet.
In summary, the near-doubling of inventories does not indicate slowing sales. Instead, it reflects a proactive strategic expansion in preparation for the Blackwell product cycle.
Inventory Health: Strategic Ramp-up vs. Emerging Overhang Risks
-
The sharp increase in WIP and Finished Goods is consistent with a mass production and delivery ramp, likely tied to new platform transitions.
-
However, higher Finished Goods also increase inventory digestion sensitivity.
-
Risk signal: If Finished Goods continue to rise while revenue growth decelerates, this would indicate emerging inventory overhang and should be treated as a red flag.
| Item | Jan 26, 2025 | Oct 26, 2025 | Absolute Change | |
|---|---|---|---|---|
| Total Inventories | 10,080 | 19,784 | +9,704 | |
| Raw Materials | 3,408 | 4,209 | +801 | |
| Work in Process (WIP) | 3,399 | 8,735 | +5,336 | |
| Finished Goods | 3,273 | 6,840 | +3,567 |
Inventory Provisions and Excess Purchase Obligations
NVIDIA FY2026 Q3 (USD millions)
1. Inventory Provisions (Recognized in Cost of Revenue)
| Period | FY2025 Comparison | FY2026 Amount | Change | Accounting Treatment | Interpretation |
|---|---|---|---|---|---|
| Quarterly | 322 | 378 | +56 | Cost of revenue | Higher write-downs during active production ramp |
| Nine Months | 876 | 3,600 | +2,724 | Cost of revenue | Material increase, indicating elevated inventory risk management |
Inventory provisions increased sharply on a year-over-year basis, especially on a nine-month cumulative basis, directly reducing gross margin through cost of revenue.
2. Excess Inventory Purchase Obligations
(Recorded in Accrued and Other Current Liabilities)
| Item | Jan 26, 2025 | Oct 26, 2025 | Change | Balance Sheet Classification | Interpretation |
|---|---|---|---|---|---|
| Excess Inventory Purchase Obligations | 2,095 | 2,770 | +675 | Current liabilities | Reflects firm supply commitments exceeding near-term demand |
This item represents non-cancellable or economically binding supply commitments that exceed expected inventory needs, increasing downside risk if demand slows.
Interpretation
-
Inventory provisions and excess purchase obligations are both elevated and increasing, confirming that NVIDIA is actively absorbing risk from aggressive capacity commitments.
-
While management frames part of the impact as H20-specific and transitional, the absolute magnitude is large enough to:
-
Cap near-term margin expansion
-
Increase sensitivity to any demand deceleration
-
-
Monitoring trigger:
Continued growth in excess purchase obligations without corresponding revenue acceleration would signal a shift from “controlled ramp risk” to structural inventory overhang.
Shareholder Returns: $12.7 Billion via Repurchases and Dividends
Reasons:
1. Robust and Sustained Cash Flow Growth
According to the CFO’s commentary, NVIDIA generated a record $23.8B in operating cash flow this quarter. This massive influx primarily reflects the significant revenue surge (up 62% year-over-year), providing the company with ample capital to return to shareholders after covering all operating expenses and capital investments.
2. High Revenue Visibility and Strategic Confidence
The CFO highlighted exceptional visibility into the Blackwell and future Rubin product lines, with an estimated $0.5 trillion in revenue opportunities through the end of calendar year 2026. This strong confidence in long-term income is the core reason the company opted to return over 50% of its quarterly operating cash flow to shareholders rather than retaining it as reserves.
Impact:
1. Accretive to Earnings Per Share (EPS)
By reducing the number of shares outstanding while total net income grows, the earnings allocated to each remaining share increase. This is vital for sustaining NVIDIA’s stock performance under high valuation multiples.
2. Signaling Management Confidence
Large-scale share repurchases serve as a powerful signal to the market. They demonstrate that management believes the current stock price remains attractive and maintains high conviction in future revenue growth, particularly within AI infrastructure demand.
Q4 FY2026 Financial Guidance Summary
1. Revenue Guidance
NVIDIA guided Q4 FY2026 revenue to approximately USD 65.0 billion (±2%). Compared with Q3 FY2026 revenue of USD 57.0 billion, this implies roughly 14% quarter-over-quarter growth, highlighting sustained momentum into year-end.
On a year-over-year basis, revenue is set to nearly triple versus approximately USD 22.1 billion in Q4 FY2025, reflecting the large-scale ramp and increasing revenue contribution of the Blackwell platform.
Management emphasized that this outlook does not assume any Data Center compute revenue from China, underscoring the conservative nature of the guidance.
2. Gross Margin Outlook
For Q4 FY2026, NVIDIA expects GAAP gross margin of approximately 74.8% (±50 basis points) and non-GAAP gross margin of approximately 75.0% (±50 basis points).
Despite the ongoing architectural transition from Hopper to Blackwell, which typically introduces higher initial system complexity and input costs, the company expects gross margins to remain in the mid-70% range. This reflects strong pricing power at the system and platform level, a favorable mix shift toward Data Center revenue, and improved cycle times and cost discipline across the supply chain.
Management also reiterated its intention to hold gross margins in the mid-70% range into FY2027, even as industry input costs continue to rise.
3. Operating Expenses and Other Items
Looking ahead to FY2027, NVIDIA provided an indicative cost framework rather than a single-quarter forecast. Non-GAAP operating expenses are expected to be approximately USD 5.0 billion per quarter, while GAAP operating expenses are expected to be approximately USD 6.7 billion per quarter.
These spending levels reflect continued investment in advanced systems engineering, expansion of the software and networking stack, and development of next-generation platforms, including Rubin.
Other income and expense is expected to be approximately USD 500 million of net income, excluding gains or losses from equity investments. The effective tax rate is expected to be approximately 17%, plus or minus 1%, driven by a higher proportion of U.S.-based revenue.
Strategic Implications Behind the Guidance
The USD 65 billion revenue outlook exceeded most market expectations and directly addresses concerns that AI infrastructure spending could decelerate. Management messaging reinforced that Blackwell demand remains supply-constrained, with strong orders from hyperscalers, enterprises, GPU cloud providers, and sovereign AI initiatives.
The guidance also indicates that NVIDIA has successfully navigated earlier Blackwell design changes and production bottlenecks, with capacity now ramping rapidly. The CFO highlighted exceptionally high revenue visibility through calendar year 2026, providing a strong foundation for long-term investor confidence.